Application Response Time: Metrics, Optimization & Best Practices



If you had to pick just one metric that matters the most for user experience, application response time would be a safe bet.
Indeed, although talking about response time might feel less exciting in the AI era than discussing items like token costs or context engineering, the fact is that application response time remains a foundational pillar of overall application performance. By extension, knowing how to measure and optimize response time is a critical responsibility for every IT team tasked with managing software.
Read on for details on how to do this well as we unpack what application response time means, what influences it and best practices for optimizing the responsiveness of software systems.
What is application response time?
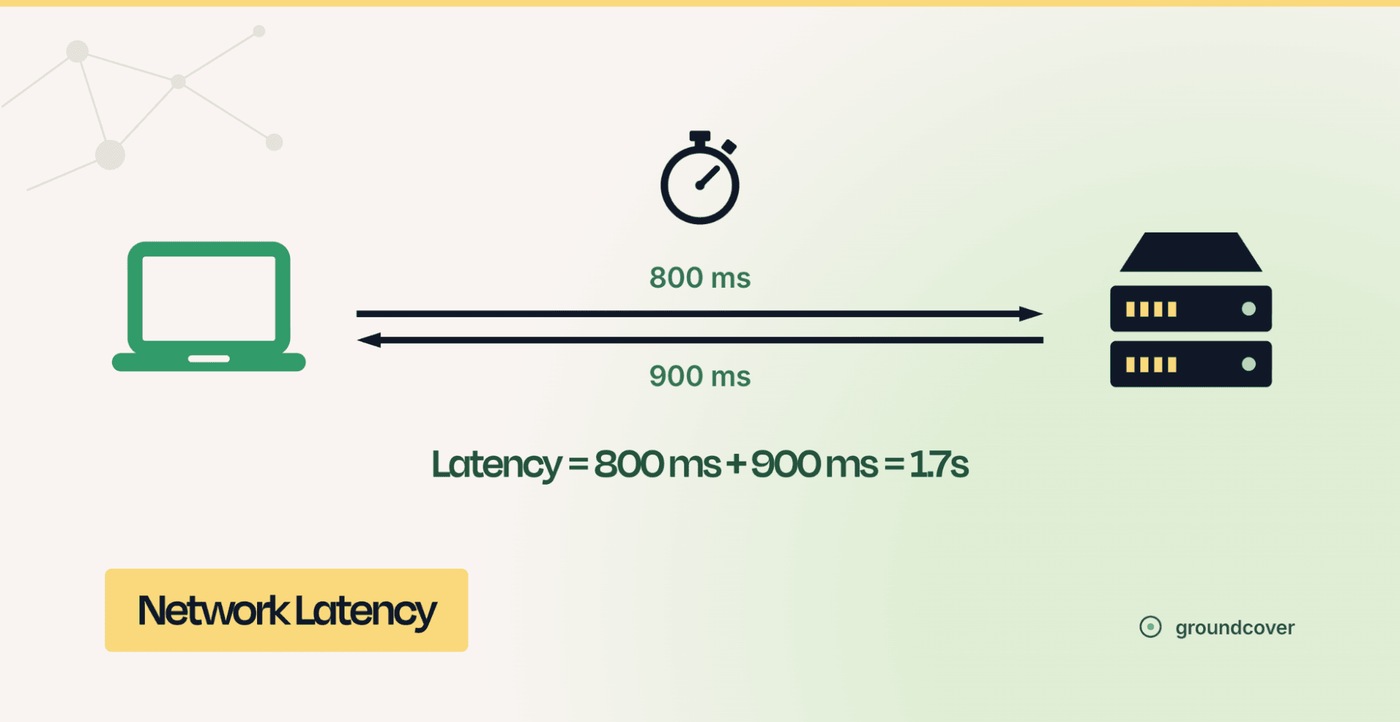
In the context of software application performance management, application response time refers to the time between when a user sends a request and when the response is displayed.
A classic example of application response time is how long it takes a Web page to load when a user clicks on a link to it. If loading time is one second, the application’s response time would be one second.
Note that application response time applies not just in the context of human-to-machine interactions, but also in cases where the “user” is non-human. For instance, if an application makes a query to a database, the time it takes for the database to return the requested information could be considered application response time.
Why application response time matters for user experience
Application response time plays a central role in user experience for a simple reason: Users don’t like waiting, and the longer application response time is, the longer the delay they face when getting a computer or application to do what they want.
Research shows that response times of as little as 0.1 seconds are noticeable to users. Delays longer than 1 second reduce conversions (meaning the percentage of users who make purchases) on retail sites. Most users will abandon a website or app entirely once the loading time reaches the 6 to 10 second range.
It’s worth noting, too, that user expectations for application response speed are likely only to grow less forgiving over time. The overall trend is toward higher bandwidth for Internet connections, leading users to become accustomed to ever-higher standards in the realm of application response time. And when apps don’t respond quickly enough, they’re likely to blame the apps (or the business that owns or manages them), not their network connections.
How to measure application response time: Key metrics
While application response time can be defined in general terms as a single metric – the time between when a request is sent and when the response is received – measuring response time fully, and gaining the context necessary to pinpoint the source of slow responses, requires working with several distinct metrics:
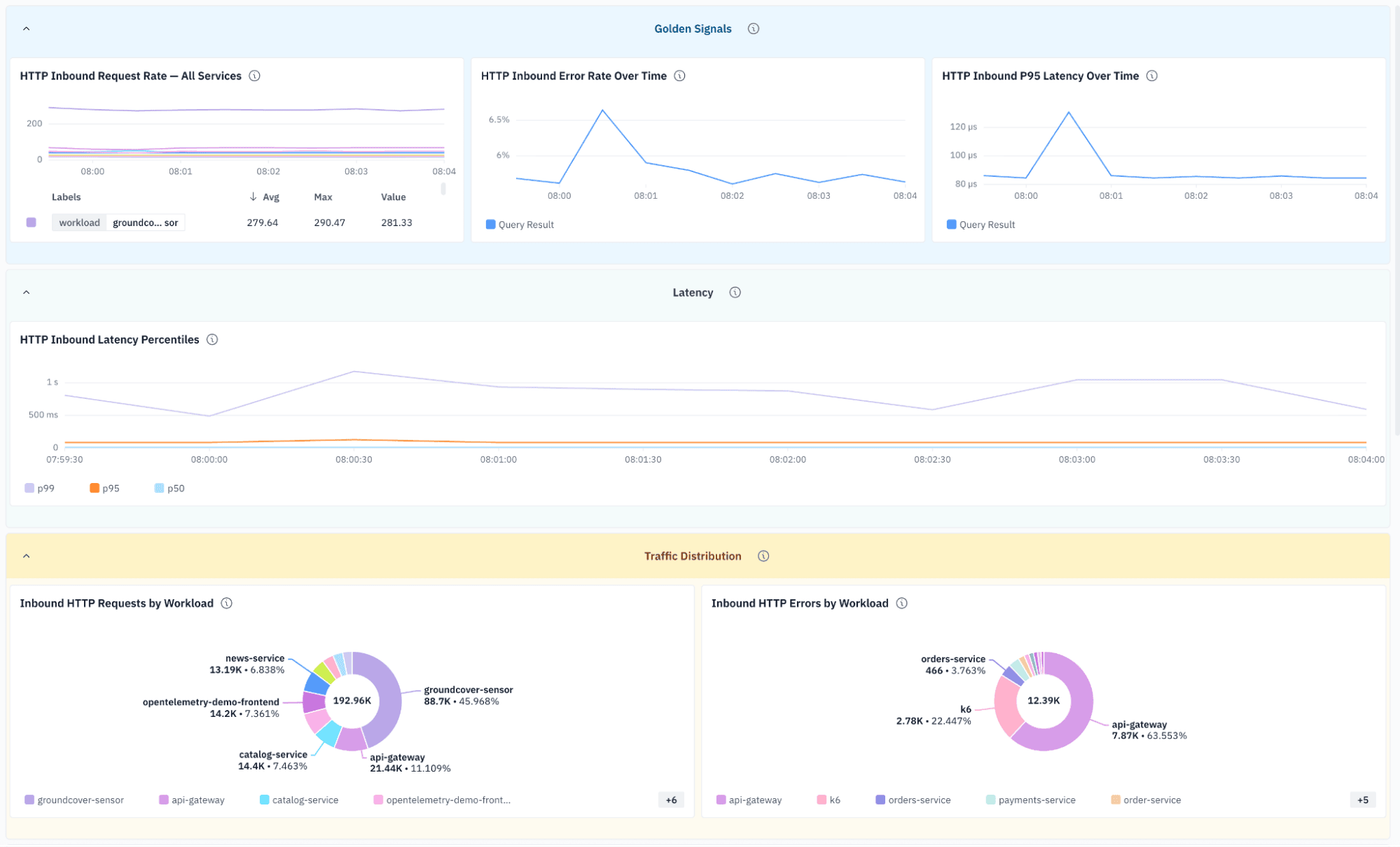
- Overall latency: The metric that maps most directly onto general application response time. Measures the total time an application takes to process a request and return a response to the user. Tracking average latency, median latency, and trends over time helps identify overall performance degradation.
- Percentile latency (p95, p99): Measures the slowest responses experienced by a specific percentage of users. For example, p95 latency shows the response time that 95% of requests fall below, helping teams detect performance issues that averages may hide.
- Time to first byte (TTFB): Measures the time between a client sending a request and receiving the first byte of the response. High TTFB can indicate backend processing delays, database bottlenecks, or network latency.
- Request throughput: Measures the number of requests an application processes over a given period, such as requests per second (RPS). Monitoring throughput alongside response time helps determine whether increased traffic or workload changes are affecting performance.
- Error rate and failed request latency: Tracks the percentage of failed requests and the response times associated with errors. Spikes in slow failures can indicate issues such as overloaded services, dependency failures, or resource constraints.
So, rather than simply tracking overall latency, it’s important to collect metrics that measure different types of latency, along with related data points like request throughput.
Factors that influence application response time
One of the tricky things about improving application response time is that many factors can impact it – and some (like network performance or end-user device computing capacity) are not always within the control of the organization that deploys an application.
Here’s an extended list of the many factors that can play a role in app responsiveness:
- Application code efficiency: Poorly optimized code, inefficient algorithms, excessive processing loops and unnecessary computations can increase the time required to handle requests and generate responses.
- Application architecture: Design choices such as service communication patterns, microservice dependencies, load balancing and request routing can affect how quickly requests are processed.
- Database performance: Slow database queries, missing indexes, inefficient data models, large result sets and database resource constraints can significantly increase application response times.
- Hosting infrastructure resource constraints: Limited CPU, memory, storage or network capacity can create bottlenecks that delay request processing, especially during periods of high traffic.
- Local infrastructure constraints: Apps that require client-side processing may respond more slowly due to lack of available CPU, memory or storage on end-user devices. For instance, a server may send a request quickly, but the user may not see it immediately because local resource limitations prevent rapid rendering of the response on the screen.
- Network latency: Delays between clients, application servers, databases and external services can increase overall response time. Geographic distance, bandwidth limitations and network congestion can contribute to slower responses.
- Traffic volume and workload: Increased user activity, request spikes and resource-intensive operations can overwhelm application components and cause slower response times.
- Third-party service dependencies: Applications that rely on external APIs, payment gateways or other services may experience slower responses when those dependencies have high latency or availability issues.
- Caching effectiveness: Properly configured caches can reduce response times by avoiding repeated computations or database queries, while poor cache strategies can lead to unnecessary processing overhead.
- Configuration and deployment settings: Incorrect resource limits, inefficient server configurations, poor autoscaling policies or suboptimal runtime settings can negatively impact application performance.
- Concurrent operations and contention: High levels of parallel requests competing for shared resources (such as database connections, locks or memory) can increase processing delays.
Application response time monitoring and process overview
Tracking and optimizing application response time requires a monitoring strategy that allows a team to measure how quickly an application handles user requests and returns results.
The monitoring process typically begins by collecting telemetry data from application components, including frontend interfaces, APIs, backend services, databases and third-party dependencies. Application performance monitoring (APM) tools use instrumentation, distributed tracing, logs and metrics to measure request execution times and identify where delays occur. This data helps teams break down response times into individual stages, such as network communication, application processing, database queries and external service calls.
After collecting and analyzing response time data, teams can use performance insights to troubleshoot issues and optimize application behavior. For instance, they can investigate slow transactions, resource bottlenecks and performance trends to determine root causes of poor responsiveness (such as inefficient code, database problems or infrastructure constraints).
Challenges in Managing Application Response Time
While managing application response time is critical for guaranteeing a positive user experience, it can also prove deeply challenging.
One reason is that, as noted above, not all of the factors that shape response time are necessarily within an organization’s control. For example, poor performance on the network connection that end-users rely on to connect to a SaaS app, or problems with third-party application plugins that are hosted remotely, are not usually issues that a business can address itself.
It can also be tough to predict when and to what extent application load will peak – and therefore to get ahead of issues like limited resource availability. While monitoring overall request trends is critical for anticipating when it will be necessary to scale up hosting resources to accommodate higher demand, requests can still sometimes surge with little warning due to events like unexpected user interest in a site or app or DDoS attacks.
System complexity presents a third challenge, especially for applications that use complex architectures (like microservices) or that are hosted in distributed environments (like a Kubernetes cluster). In these circumstances, the multiple components that applications depend on can interact in complex ways, making it more challenging to pinpoint the root cause of slow application responses.
For example, if a microservices app hosted in Kubernetes is slow to respond, it could be due to problems with the code in a particular microservice. Or, it could be resource constraints on the node that happens to host the app’s containers. Poorly configured Kubernetes requests or limits, network connectivity problems, or service mesh performance issues could also be at play.
Best practices for optimizing application response time
The best way to optimize application response time is to take a proactive approach that minimizes the risk of slow performance to begin with, and equip teams to detect and handle issues quickly when they do arise.
The following best practices can help:
- Optimize application code: Review and improve inefficient algorithms, unnecessary computations, and slow execution paths. Use profiling tools to identify performance bottlenecks and refactor code to reduce processing time.
- Improve database performance: Optimize queries, add appropriate indexes, reduce unnecessary data retrieval, and tune database configurations. Efficient database operations can significantly reduce delays in application response times.
- Implement effective caching strategies: Use application, database, and content delivery network (CDN) caching to reduce repeated processing and improve response speed. Ensure cached data is properly managed to balance performance gains with data freshness requirements.
- Scale infrastructure resources appropriately: Monitor CPU, memory, storage, and network utilization to identify resource constraints. Use load balancing, autoscaling and capacity planning to ensure applications can handle changing workloads without performance degradation.
- Monitor and optimize external dependencies: Track the performance of APIs, microservices and third-party services that applications rely on. Use timeouts, retries, circuit breakers and fallback mechanisms to prevent slow dependencies from impacting overall response time.
- Enable continuous monitoring: Periodic or ad hoc monitoring is not enough to detect slow application responses reliably – particularly because it’s often the case that only some responses are slow, and they may not be caught by periodic metric collection. Instead, strive for continuous, ongoing monitoring.
Common mistakes that slow down application response time
Optimizing response time also depends on avoiding mistakes like the following:
- Poorly optimized database operations: Slow queries, missing indexes, inefficient joins and retrieving more data than necessary can create significant delays. Applications should regularly analyze database performance and optimize queries and data access patterns.
- Excessive external service dependencies: Relying on multiple APIs, third-party services or microservices without proper timeout controls can increase response times. Slow or unavailable dependencies can create cascading delays throughout the application.
- Insufficient resource management: Failing to monitor and allocate adequate CPU, memory, storage, and network capacity can cause applications to slow under normal or peak workloads. Poor scaling strategies and resource bottlenecks often lead to increased latency.
- Inefficient application design and code: Unoptimized algorithms, unnecessary processing, excessive API calls and poor caching strategies can increase the time required to complete requests. Regular code reviews, profiling and performance testing help identify and resolve these issues.
Tools and techniques for monitoring application response time
A variety of tools and methods exist for helping to monitor and manage application response time. Key types of solutions include:
- Metrics collection via systems that gather time-series data such as response time percentiles, throughput and system resource utilization.
- Log analysis to provide additional context for investigating performance problems.
- Distributed tracing, which helps track individual requests as they move through multiple services, making it easier to identify slow components, bottlenecks and dependency issues.
- Synthetic monitoring, an approach that sends manufactured requests to applications to track performance data, including response times.
- Real-user monitoring, which monitors response times and other metrics based on “live” requests by real-world users.
- Load testing, which allows teams to evaluate how well applications respond as request volume varies.
How groundcover improves application response time visibility
Optimizing application response time depends on having comprehensive visibility into response rates, as well as the context necessary to identify and resolve root causes when responses are slow.
This is where groundcover comes in. By continuously monitoring latency, error rates, resource utilization and much more in complex, distributed environments like Kubernetes, groundcover empowers engineers to detect and troubleshoot poor application responsiveness. With groundcover, you’ll know quickly whether the underlying cause of slow responses is, say, your application code, a Kubernetes node, Kubernetes configuration settings or another of the many types of potential root causes.
A healthy response to slow application response
The bottom line: In a world where application response time remains the single most important metric for delivering a great user experience, knowing how to detect and diagnose slow responses is as critical as ever.
That’s why solutions like groundcover, which provide continuous, context-informed visibility into real-world response times, are an essential part of modern application performance management strategies – especially for organizations that depend on complex, distributed environments like Kubernetes.