Kubernetes Overspending Alerts: Setup, Best Practices & Tools




Key Takeaways
- Kubernetes clusters often waste money because CPU, memory, storage, and namespaces are overallocated or left running long after they're needed, and those costs usually stay hidden until the cloud bill arrives.
- Overspending alerts use metrics like unused CPU requests, idle namespaces, underused storage, and rising spend to notify teams early, making it easier to fix waste before it becomes a budget problem.
- Prometheus and Alertmanager can power these alerts by comparing requested resources with actual usage, routing notifications to the teams that own each namespace, and reducing unnecessary noise with sensible thresholds and grouping.
- The most effective cost monitoring combines threshold-based alerts for clear limits with anomaly detection for gradual changes, while separating cost alerts from reliability alerts to avoid alert fatigue.
Kubernetes gives teams the ability to scale in seconds, but that same elasticity is exactly why clusters bleed money so quietly. According to CAST AI's 2026 State of Kubernetes Optimization Report, average CPU utilization across sampled clusters actually fell from 10% to 8% year over year, while CPU overprovisioning climbed from 40% to 69%. The gap between what teams pay for and what they actually use is widening, not narrowing, even as cost has become a board-level conversation. Kubernetes overspending alerts are how engineering teams close that gap before it shows up as a painful line item on next month's cloud invoice.
This article covers what these alerts are, why clusters overspend without them, how to build them with Prometheus and Alertmanager, and which practices and tools keep the noise manageable.
What Are Kubernetes Overspending Alerts?
Kubernetes overspending alerts are automated notifications triggered when resource consumption, allocation, or cost patterns in a Kubernetes cluster cross a defined threshold or deviate from an expected baseline. Rather than waiting for a monthly cloud bill to reveal the damage, these alerts fire in near real time when something like idle CPU, an oversized memory limit, or an unattached persistent volume starts costing more than it should.
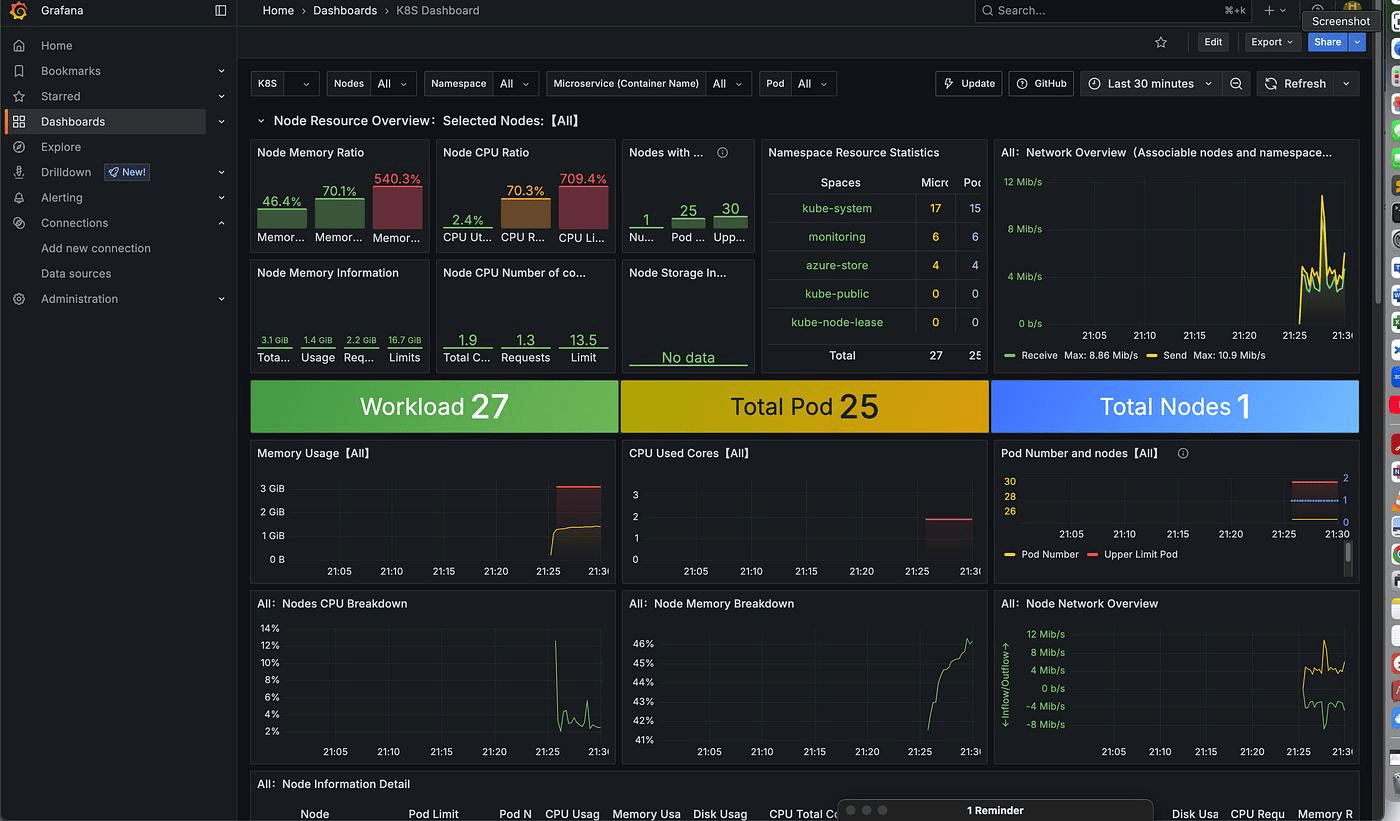
Unlike generic performance alerts, which typically watch for latency spikes or pod crashes, overspending alerts are tied directly to cost signals: how much of a namespace's allocated resources are going unused, how quickly a workload's spend is trending upward, or whether autoscaling decisions are inflating the node count unnecessarily. They sit at the intersection of Kubernetes monitoring and FinOps, translating raw resource utilization data into dollar-denominated signals that both engineers and finance teams can act on.
Why Kubernetes Clusters Overspend Without Alerts in Place
Kubernetes infrastructure doesn't overspend because engineers are careless. It overspends because the defaults reward caution, and caution is expensive at scale. A few patterns show up again and again:
- Requests set for the worst case, never revisited. Engineers set CPU and memory limit values high enough to survive a traffic spike, then rarely revisit them once the service is stable.
- Autoscalers scaling on the wrong signal. A Horizontal Pod Autoscaler tuned to CPU alone can add replicas for a memory-bound workload, driving up node count without improving throughput.
- Zombie namespaces. Staging and QA namespaces frequently outlive the sprint they were created for, quietly consuming reserved capacity.
- Orphaned persistent volumes. Deleting a StatefulSet doesn't always delete its underlying storage claim, leaving storage costs to accrue against nothing.
- No feedback loop between spend and the team that caused it. Without namespace or team-level attribution, nobody owns the cost, so nobody fixes it.
Spectro Cloud's 2025 State of Production Kubernetes survey found that cost overtook both skills gaps and security as the top Kubernetes operations challenge for 42% of organizations, with 88% reporting a year-over-year rise in total Kubernetes TCO. Without alerting, these issues stay invisible until someone in finance asks a question nobody in engineering can answer.
Types of Kubernetes Overspending Alerts
Not every overspending alert looks the same, and a mature alerting rules strategy usually layers several types together:
- Threshold-based alerts that fire when a metric crosses a static value, such as "namespace CPU request exceeds 500 cores"
- Trend-based alerts that fire when spend or utilization is moving in a bad direction over a rolling window, even before it crosses a hard limit
- Anomaly-based alerts that fire when current behavior deviates statistically from historical baselines
- Idle resource alerts for allocated resources sitting unused for an extended period
- Budget-based alerts that fire once projected monthly spend, extrapolated from current burn rate, is on track to exceed an assigned budget.
Key Metrics to Track for Kubernetes Cost Alerting
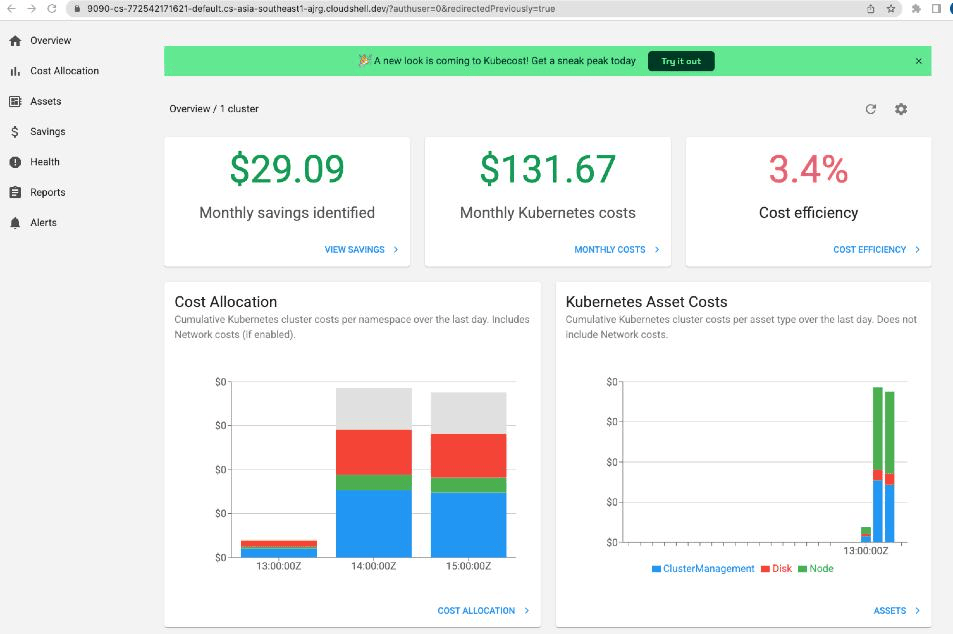
Before writing a single alert rule, it helps to agree on which signals actually matter. The table below outlines the core metrics most teams build their Kubernetes cost alerting strategy around.
| Metric | What It Measures | Why It Matters for Cost |
|---|---|---|
| CPU request vs. usage | Difference between requested and consumed CPU | Measures over-allocation and wasted compute spend |
| Memory limit vs. usage | Difference between memory limit and actual usage | Flags oversized memory limit values driving node bloat |
| Node utilization | Aggregate CPU/memory usage across all pods on a node | Identifies underused nodes that could be consolidated |
| Idle namespace duration | Time a namespace has had near-zero traffic | Surfaces abandoned or forgotten environments |
| Persistent volume utilization | Used vs. provisioned storage on PVCs | Highlights overprovisioned or orphaned storage costs |
| Network traffic / egress volume | Data transferred out of the cluster or across zones | Cross-zone egress can quietly dominate a bill |
| Cost per namespace/team | Allocated spend attributed to a namespace or team | Enables accountability and budget-based alerting |
How to Set Up Kubernetes Overspending Alerts With Prometheus and Alertmanager
Prometheus and Alertmanager remain the most common foundation for Kubernetes monitoring, and cost alerting fits naturally on top of the same stack most teams already run for reliability alerting. Setting it up well comes down to four steps.
1. Identify the Cost Metrics and Thresholds That Matter
Start by mapping the metrics from the table above to real Prometheus metric names. If you're running kube-state-metrics alongside cAdvisor, kube_pod_container_resource_requests, container_cpu_usage_seconds_total, and kube_persistentvolumeclaim_resource_requests_storage_bytes are the usual starting points. Agree on thresholds with the teams that own the workloads rather than setting them unilaterally. A threshold too aggressive for a batch-processing namespace will generate noise nobody trusts.
2. Write PromQL Expressions for Each Alert Scenario
Once thresholds are agreed on, translate them into PromQL. A common pattern is comparing requested resources against actual usage over a rolling window:
This expression flags a namespace where over 70% of requested CPU sits unused for six straight hours, a strong signal that the team can safely shrink its resource requests without risking a slowdown.
3. Configure Alertmanager Routing and Notification Channels
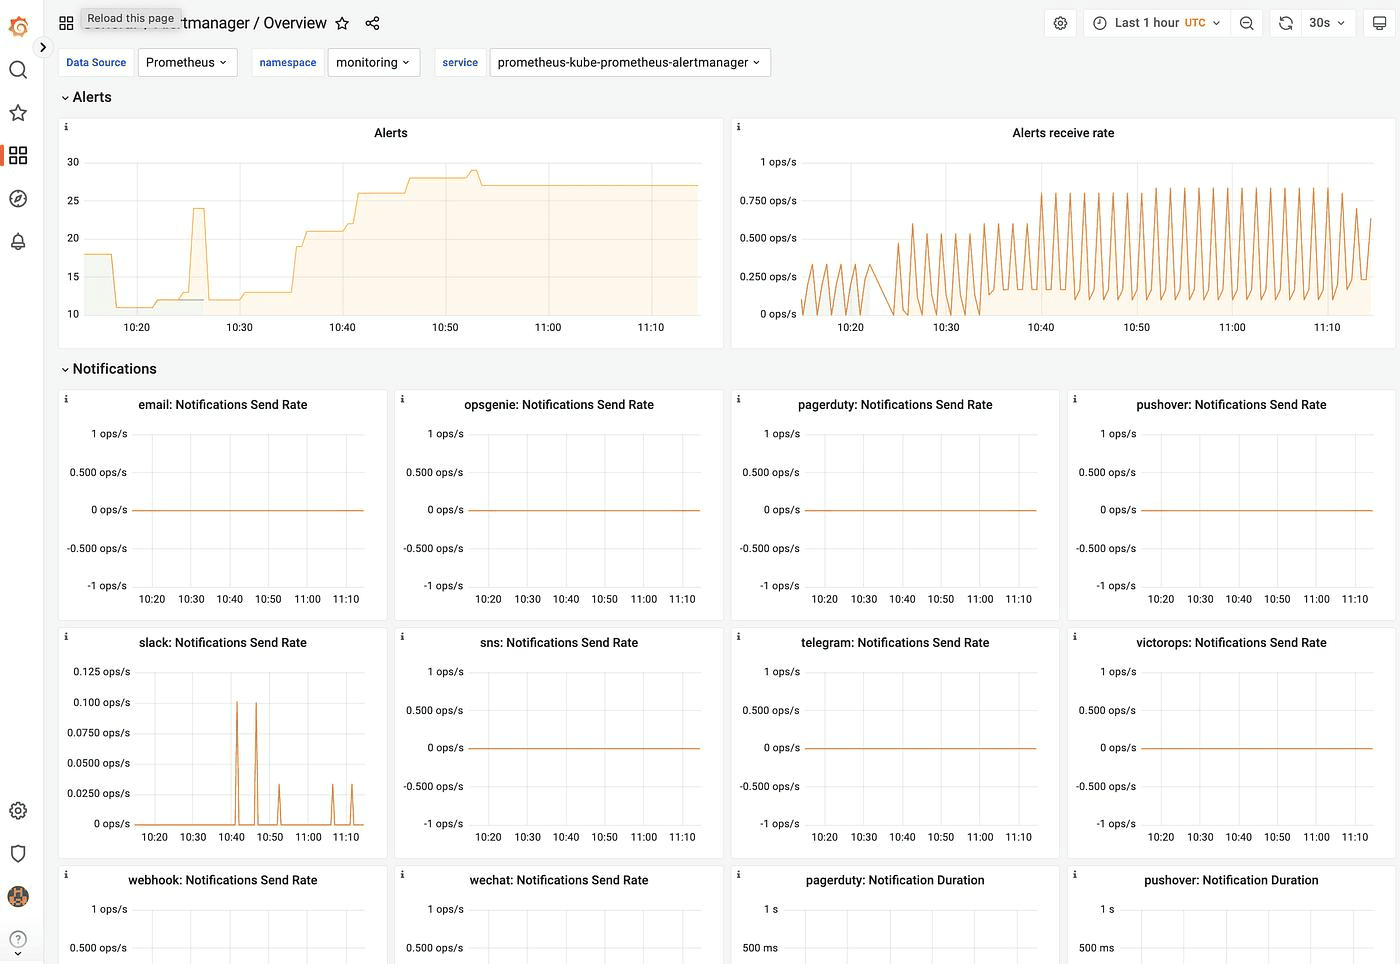
Cost alerts rarely need the urgency of an outage, so route them differently. A dedicated receiver, grouped by namespace and sent to Slack rather than a pager, keeps the signal proportional to the stakes:
4. Validate Alerts in a Non-Production Environment Before Rolling Out
Test new rules against a staging cluster or a historical Prometheus snapshot before pushing to production. This catches obvious false positives, like flagging a legitimately bursty batch job as "idle," before the alert erodes trust in the whole system.
Kubernetes Namespace-Level Overspending Alerts
Cluster-wide alerts tell you something is wrong; namespace-level alerts tell you whom to talk to about it.
Tagging every resource request with a namespace, team, or cost-center label lets you route alerts directly to the engineers who own the workload, rather than funneling everything through a central platform team with no context on why a service is shaped the way it is.
This is also where budget-based alerting tends to live: assign each namespace a soft monthly ceiling, and trigger a notification once projected spend crosses 80% of that number.
Idle Resource Alerting in Kubernetes: Catching Waste Before the Bill Arrives
Idle resources are the easiest waste to eliminate and the easiest to miss, because nothing is technically broken. A namespace can allocate resources, run without errors, and still be an active drain on the budget.
Idle alerts typically watch for pods with sustained CPU usage below 5% of their request over a multi-day window, deployments scaled to a replica count higher than their observed traffic requires, load balancers provisioned for services that have since been decommissioned, and nodes running at low aggregate utilization that could be consolidated through better bin-packing.
Because idle waste accumulates slowly, a weekly or daily digest alert often works better than a real-time one. The goal is a recurring nudge, not an interruption.
Persistent Volume and Storage Cost Alerts in Kubernetes
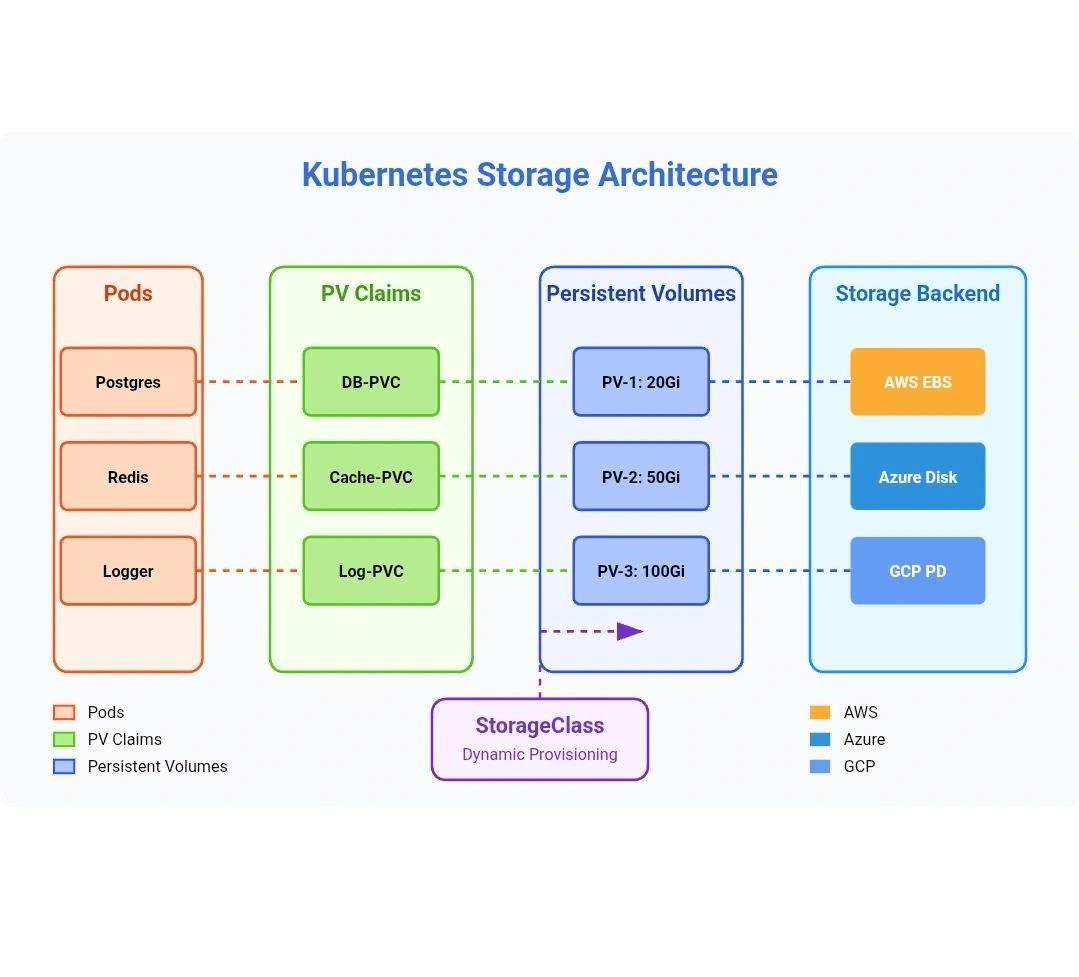
Storage costs are easy to overlook because they don't show up in CPU or memory dashboards at all. A deleted StatefulSet doesn't always take its PersistentVolumeClaims with it, and unattached volumes keep billing quietly in the background.
Effective storage alerts watch for PVCs with utilization below a set percentage of their provisioned size, volumes unattached to any pod for more than a few hours, and snapshot retention policies that have drifted past their intended lifecycle.
On managed cloud storage classes, it's also worth alerting on tier mismatches, like high-performance SSD-backed volumes provisioned for data that's rarely read.
Kubernetes Cost Anomaly Detection vs. Threshold-Based Alerts
Threshold-based alerts are simple to reason about but blunt: a static number can't account for seasonal traffic, deployment cycles, or gradual growth. Anomaly detection instead learns a baseline from historical behavior and flags deviations from it, catching problems a fixed threshold would either miss or over-trigger on.
| Dimension | Threshold-Based Alerts | Anomaly Detection |
|---|---|---|
| Setup complexity | Low; define a static number | Higher; requires historical data and a model |
| Best suited for | Stable, predictable workloads | Variable or seasonal traffic patterns |
| False positive risk | Higher during legitimate spikes | Lower once baseline is well-trained |
| Time to value | Immediate | Takes weeks of data to calibrate |
| Maintenance overhead | Requires manual threshold tuning over time | Adjusts automatically as patterns shift |
In practice, most mature Kubernetes operations teams run both: thresholds for hard limits that should never be crossed regardless of context, and anomaly detection for the subtler, slower-moving cost drift that a static number would never catch.
Avoiding Alert Fatigue in Kubernetes Cost Monitoring
An alerting system that fires constantly gets ignored, and an ignored cost alert is worse than no alert at all because it creates false confidence.
Group related alerts by namespace or root cause instead of firing one per pod, use for: durations in Prometheus rules so short-lived spikes don't trigger a page, and keep cost alerts on their own notification channel and cadence, separate from reliability alerts.
Review and prune alert rules quarterly, since a rule nobody has acted on in six months is just noise, and attach clear remediation guidance to every alert annotation so the recipient knows the next step without digging through dashboards.
Tools for Kubernetes Overspending Alerts
Several categories of monitoring tools support Kubernetes overspending alerts, each with a different scope:
- Prometheus + Alertmanager is the open-source foundation for custom PromQL-based cost alerting, tightly integrated with existing Kubernetes monitoring stacks.
- OpenCost is a CNCF-maintained project that attributes real cloud provider pricing to namespaces, deployments, and labels.
- Kubecost builds on top of it with a managed UI and multi-cluster cost allocation.
- Cloud-native billing alerts like AWS Budgets or GCP Billing Alerts are useful for account-level spend but blind to what's happening inside the cluster.
- Full-stack observability platforms combine cost signals with performance and infrastructure telemetry, so teams get both in one place instead of stitching tools together.
Best Practices for Kubernetes Overspending Alerts
| Practice | Why It Matters |
|---|---|
| Tie alerts to owners, not just clusters | Ensures every alert has someone accountable to act on it |
| Separate cost alerts from reliability alerts | Keeps on-call fatigue from bleeding into cost hygiene |
| Right-size before you alert | An alert on a poorly sized baseline just reinforces the wrong number |
| Alert on trends, not just snapshots | Catches slow cost drift before it becomes a budget overrun |
| Revisit thresholds every quarter | Traffic patterns and team size change; static thresholds go stale |
| Document remediation steps in the alert | Reduces time from notification to resolution |
Real-Time Kubernetes Overspending Alerts With Full Cluster Visibility From groundcover
Most cost alerting stacks are built by stitching Prometheus, a billing export, and a labeling convention together, which works until the cluster grows past a few hundred nodes and the queries start timing out.
groundcover takes a different approach: its eBPF-based sensor collects resource utilization, network traffic, and cost-relevant signals directly from cluster traffic without manual instrumentation. Because it runs on a BYOC architecture, that telemetry stays inside your own AWS, GCP, or Azure environment, and since pricing scales with node count rather than data volume, teams can enable granular alerting without worrying that more visibility means a bigger bill. groundcover now also ingests AWS Cost as a first-class data source, which connects cloud spend data directly into the same observability context as cluster utilization signals.
For teams evaluating Kubernetes monitoring solutions as part of a broader cost-optimization initiative, groundcover offers a self-service signup: a free tier is available indefinitely, and a 14-day trial unlocks the full platform before stepping down to the free version, so teams can test overspending alerts against their own cluster before committing to anything.
Conclusion
Kubernetes overspending alerts turn a reactive, end-of-month cost surprise into a manageable, day-to-day engineering signal. The technical pieces - PromQL expressions, Alertmanager routing, namespace-level attribution - are achievable with tools most teams already run. The harder part is discipline: picking metrics that matter, tuning thresholds so alerts stay credible, and giving every alert a clear owner. Get that right, and cost alerting stops being a finance problem bolted onto engineering, and becomes just another part of how a healthy Kubernetes cluster runs.
FAQs
Keeping observability data inside your own cloud environment removes data egress concerns while allowing organizations to retain full control over telemetry storage, governance, and compliance.
- Teams can analyze detailed utilization and cost signals without exporting operational data to a third-party SaaS backend.
- Internal cloud networking often reduces latency when correlating infrastructure telemetry with cloud billing information.
- Data residency and compliance policies become significantly easier to satisfy because telemetry never leaves the organization's cloud account.
- Organizations can retain high-cardinality operational data longer without introducing additional vendor-controlled storage layers.
Learn more about Bring Your Own Cloud Observability.
Cost alerts become noise when they report every inefficient resource instead of highlighting actionable patterns owned by specific teams.
- Aggregate alerts by namespace, application, or service rather than generating one notification per pod.
- Add sustained evaluation windows so temporary deployment spikes don't trigger alerts.
- Include recommended remediation directly in alert annotations to reduce investigation time.
- Review alert effectiveness quarterly and remove rules that consistently generate notifications without leading to action.
Learn more about Kubernetes alerting.
Use threshold alerts to enforce hard operational guardrails and anomaly detection to identify gradual cost drift that static thresholds cannot detect.
- Apply thresholds for conditions that should never happen, such as excessive overprovisioning or runaway namespace budgets.
- Use anomaly detection to recognize changing traffic patterns, seasonal workloads, and slow increases in cloud spend.
- Compare projected monthly burn rates instead of reacting only to current utilization snapshots.
- Regularly validate anomaly models against deployment events to prevent unnecessary investigations after expected releases.
Start with alerts that identify persistent waste rather than temporary spikes, because they typically uncover the largest savings with minimal operational risk.
- Alert when CPU requests exceed actual usage by 70% or more for several hours.
- Detect idle namespaces, abandoned development environments, and orphaned PersistentVolumeClaims.
- Monitor node utilization to identify consolidation opportunities before scaling infrastructure.
- Use namespace ownership labels so every alert reaches the team responsible for fixing it.
Kubernetes overspending alerts focus on preventing wasted cloud spend by detecting inefficient resource allocation, while traditional monitoring alerts focus on service health and availability.
- Performance alerts answer "Is my application healthy?" Cost alerts answer "Am I paying for resources I'm not using?"
- Overspending alerts monitor metrics like CPU request-to-usage ratios, idle namespaces, orphaned storage, and projected budget overruns, not latency or error rates.
- The most effective teams correlate cost alerts with operational telemetry so engineers can determine whether reducing resources will affect reliability before making changes.
- Cost alerts should become part of engineering workflows rather than remaining isolated in FinOps or finance dashboards.
Explore our comprehensive guide to Kubernetes monitoring.