Elasticsearch Index Health: How to Monitor, Fix & Prevent Issues



Key Takeaways
- Elasticsearch index health shows whether shards are safely allocated: green means all primary and replica shards are available, yellow means replicas are missing, and red means at least one primary shard is unavailable.
- Yellow is a warning about reduced resilience, not necessarily an outage: the cluster can still serve data, but another node failure could create a more serious availability problem.
- Red requires immediate investigation because data may already be unavailable: node failures, full disks, network issues, and lost primary shards are common causes.
- Shard allocation problems often point to broader infrastructure issues, so checking disk, node, network, and Kubernetes events alongside Elasticsearch health makes root causes easier to identify.
Anyone who has run Elasticsearch in production has watched a dashboard flip from green to yellow, or worse, red. According to Elastic's own 2026 observability trends research, 60% of organizations now describe their observability practices as mature or expert, up from 41% the year before. That progress is encouraging, but it also means teams run larger, more complex deployments than ever, and with scale comes a greater chance something quietly starts to misbehave.
Elasticsearch index health is one of the clearest early warning signals you have. It tells you, at a glance, whether your data is fully available, partially at risk, or in trouble. This article covers what index health means, how Elasticsearch calculates it, how to check it, and what to do when things go sideways, whether you run a single node or a fleet of pods in Kubernetes.
What Is Elasticsearch Index Health?
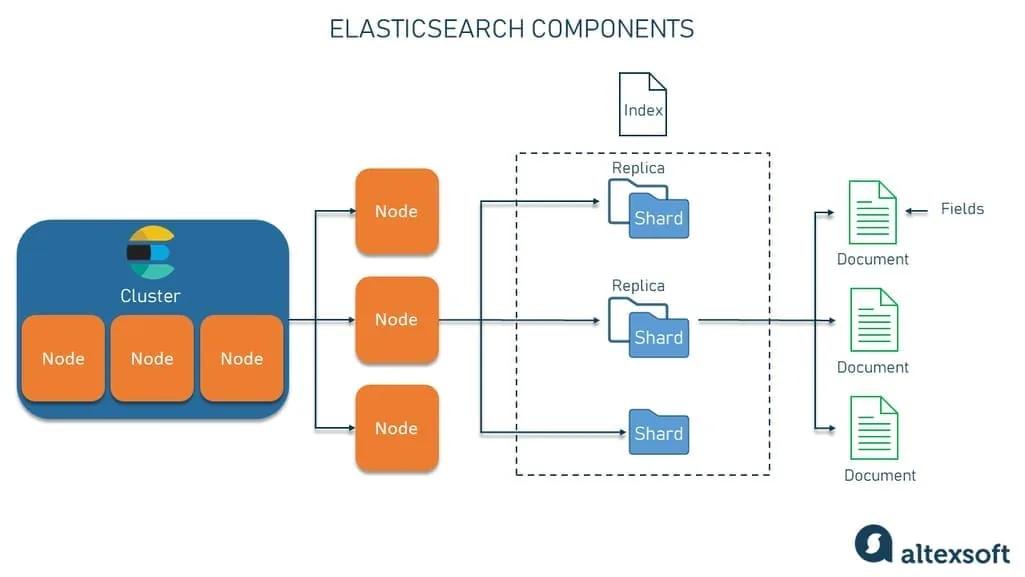
Elasticsearch index health is a status indicator, expressed as green, yellow, or red, that reflects whether the shards belonging to a specific index are properly allocated across your data nodes. Every index in an Elasticsearch cluster is broken into primary shards and, optionally, replica shards. Index health is a report card on how many shards are actually assigned and functioning.
It's worth distinguishing index health from cluster health, since the two are related but not identical. Cluster health status is a rollup of every index and always reflects the worst individual index status. If one index goes red, the entire Elasticsearch cluster health status goes red too, even if every other index is fine. Understanding this relationship is the first step toward diagnosing problems quickly instead of chasing the wrong metric.
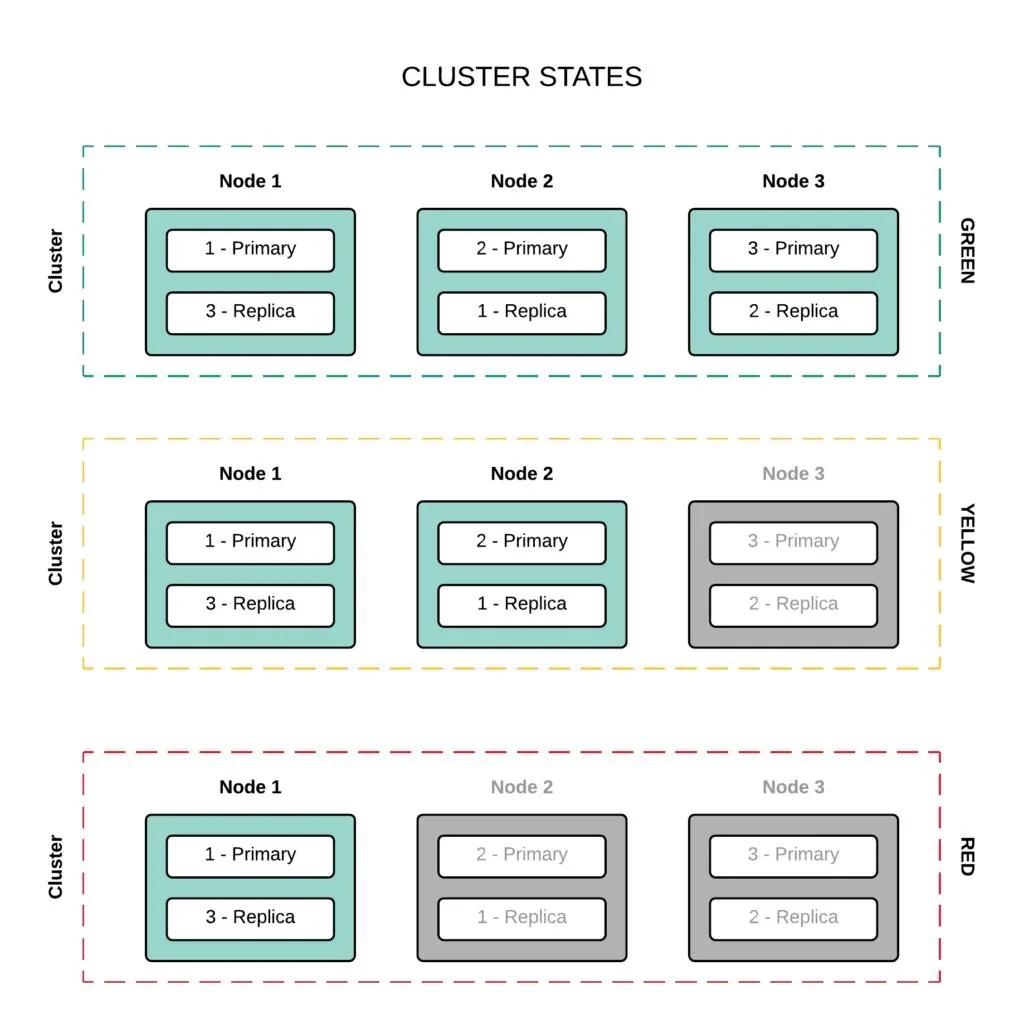
Source | Cluster Health States
Why Elasticsearch Index Health Matters in Production
A healthy cluster isn't just a vanity metric. Index health has a direct line to data availability, search accuracy, and system resilience. When shard allocation breaks down, queries can return incomplete results, indexing slows to a crawl, or writes fail outright.
In production, unhealthy index status often shows up first as symptoms rather than an obvious root cause: search latency spikes, missing documents, or alerts that fire and mysteriously resolve. A yellow status may not immediately affect availability, but it means one or more replica shards are unassigned, reducing the cluster's fault tolerance. If left unresolved, a single node failure can turn that reduced redundancy into a much more serious data availability problem.
Index health can also reveal underlying infrastructure issues before they become application failures. Node restarts, disk space exhaustion, network problems, insufficient data nodes, and prolonged garbage collection pauses can all cause shards to become unassigned. Looking at these signals alongside cluster and infrastructure metrics makes it easier to distinguish a temporary recovery event from a condition that requires immediate intervention.
That's why monitoring cluster health metrics continuously, rather than checking only when something looks broken, is a baseline best practice for teams running Elasticsearch at scale. The objective isn't simply to keep the dashboard green; it is to detect degradation early, understand the cause, and preserve enough redundancy for the cluster to recover safely when failures occur.
How Elasticsearch Calculates Index Health Status
Elasticsearch determines index health by looking at the state of every shard, primary and replica, that belongs to that index. The logic is straightforward once laid out:
- If all primary and replica shards are assigned to data nodes, the index is green.
- If all primary shards are assigned but one or more replica shards are not, the index is yellow.
- If even one primary shard is unassigned, the index is red.
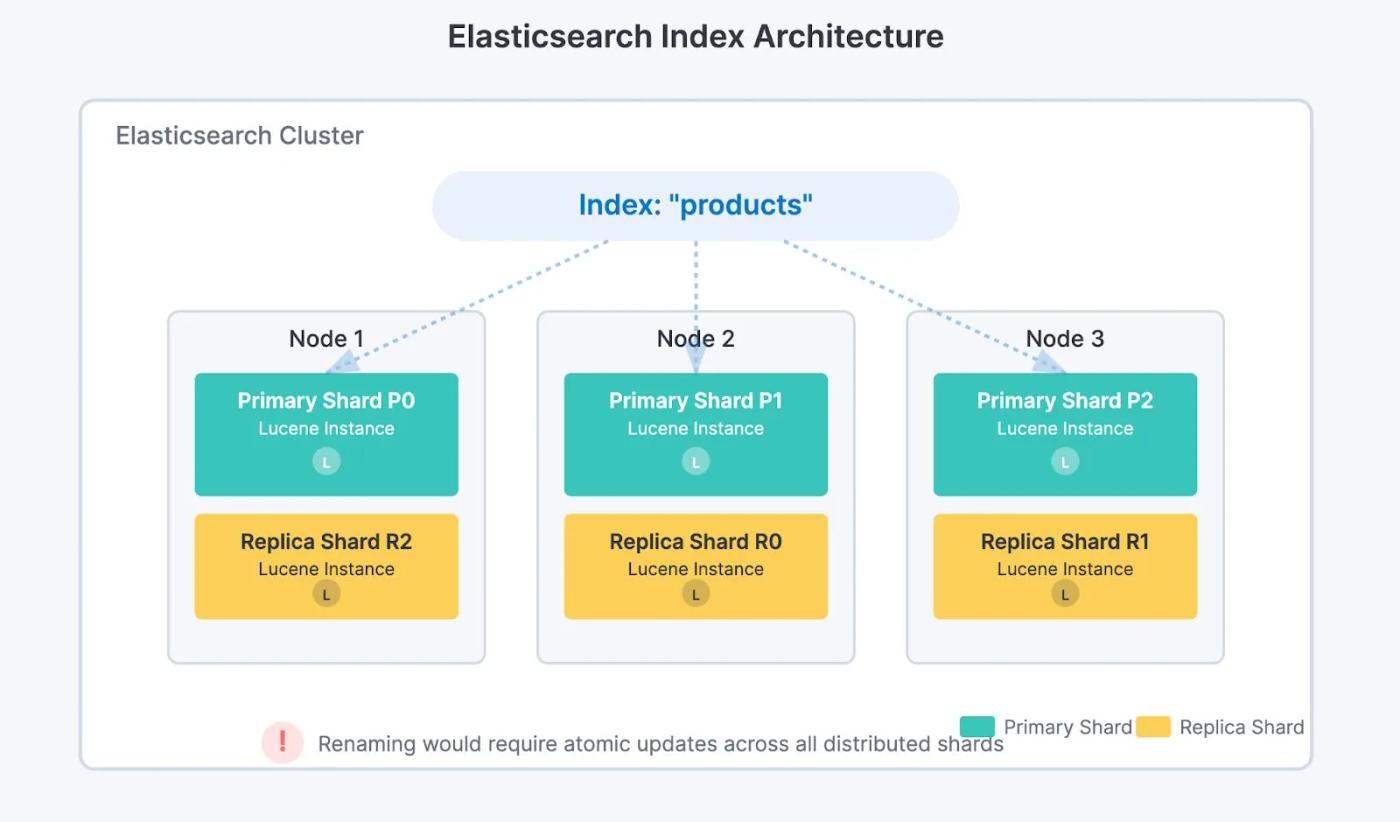
Source | Shard Replica Allocation
The overall Elasticsearch cluster health status then takes the worst status among all indices. This cascading logic is intentional: a single misbehaving index can't hide behind a sea of green ones. Elastic's Health Report API extends this concept, breaking health into individual indicators like disk, shard allocation, and ingest, so you see not just that something is wrong, but which subsystem is responsible.
Green, Yellow, and Red: What Each Index Health Status Means
Each status color maps to a specific operational reality, as the table below shows.
It's a common misconception that yellow means "broken." A single-node cluster will always report yellow status, since Elasticsearch never allocates a replica to the same node as its primary shard. That's expected behavior, though it's still worth addressing before you scale into production.
How to Check Elasticsearch Index Health
The most direct way to check Elasticsearch index health is through the Cluster Health API. A simple request returns the overall status along with key metrics:
This returns fields like status, number_of_data_nodes, active_primary_shards, and unassigned_shards. For index-level granularity, scope the request:
For a fast, readable snapshot across every index, the cat API is often more convenient:
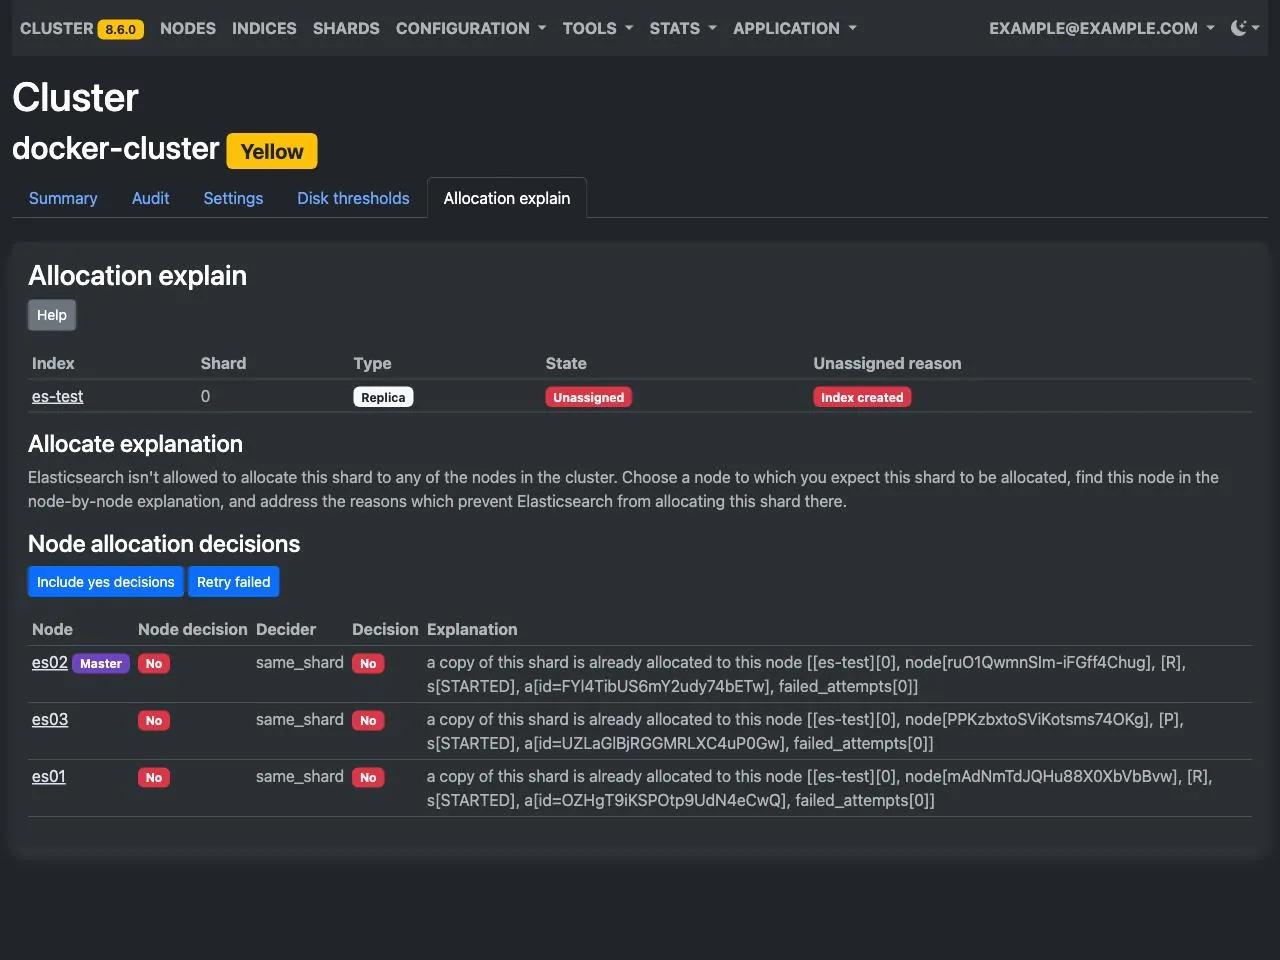
This filters the output to show only indices in a yellow or red state, useful when triaging a large Elasticsearch cluster with hundreds of indices. To dig into why a shard is unassigned, the allocation explain API is invaluable:
It returns a human-readable explanation of the last allocation decision, including whether it was blocked by disk watermarks, shard limits, or node availability.
Common Causes of Elasticsearch Index Health Degradation
Most index health problems trace back to a handful of recurring root causes:
- Node failures or restarts. When a data node drops out, every shard it hosted becomes unassigned until the node recovers or Elasticsearch reallocates shards elsewhere.
- Disk space exhaustion. Elasticsearch enforces disk watermark thresholds and stops allocating shards once a node crosses them, quickly turning healthy indices yellow or red.
- Insufficient data nodes for the replica count. Set more replicas than available nodes, and some replica shards will never find a home.
- Long garbage collection pauses. Extended GC pauses can make a node appear unresponsive, triggering the cluster to reassign shards.
- Network partitions. Temporary connectivity issues can isolate part of the cluster, leaving shards unassigned until it heals.
- Manual misconfiguration. Setting
number_of_replicasincorrectly, or deleting an index template mid-migration, are common self-inflicted causes.
Recognizing which applies to your situation is what separates a five-minute fix from a multi-hour incident.
How to Fix a Yellow Elasticsearch Index
A yellow status means your primary shards are safe, but replicas are missing. Start here:
- Confirm your node count. Run
GET _cat/nodes?vto check whether you have enough data nodes for your replica configuration. - Check the allocation explain output. This tells you why replicas aren't being assigned, whether it's a watermark issue, shard limit, or allocation filter.
- Adjust replica count if appropriate. For non-production or single-node setups, temporarily reduce replicas:
- Wait for recovery if a node is restarting. Yellow status often resolves itself once the node rejoins and Elasticsearch finishes reallocating shards.
Only reduce replicas permanently if you understand the tradeoff, since it lowers fault tolerance and read throughput.
Source | Unassigned Shards
How to Fix a Red Elasticsearch Index
Red status is more urgent, since it means data is potentially unavailable. Elastic's own guidance on red or yellow cluster status recommends this sequence:
- Identify the affected shards using
GET _cat/shards?v&h=index,shard,prirep,state,unassigned.reason. - Check node health and disk usage. A full disk is a common cause of primary shard loss.
- Review cluster logs for node departures, out-of-memory errors, or corruption warnings.
- Attempt manual reroute if shards are stuck, using the reroute API with caution:
- Restore from snapshot if a primary shard is genuinely lost. This is why regular snapshot policies aren't optional for production clusters.
Red status should always trigger an incident response process, since it directly affects availability.
Elasticsearch Index Health in Kubernetes Environments
Running Elasticsearch on Kubernetes, whether through the ECK operator or a custom Helm chart, introduces layers that can affect index health. Pod evictions, node autoscaling events, and persistent volume reattachment delays can trigger the same unassigned shard symptoms you'd see on bare metal, but with less visibility underneath.
A few Kubernetes-specific considerations stand out:
- Pod disruption budgets should be configured so rolling updates or node drains don't take down more data nodes than your replica configuration can tolerate.
- StatefulSet ordering matters. Pods that restart out of order can temporarily confuse shard allocation, especially with strict allocation awareness rules.
- Persistent volume performance affects recovery time. Slow storage classes extend the window an index sits inside the yellow or red status after a pod restart.
Because Kubernetes abstracts away much of the underlying infrastructure, teams running Elasticsearch on it benefit from tooling that correlates pod events with shard allocation changes, rather than treating them as separate signals to investigate manually.
Monitoring Elasticsearch Index Health in Production
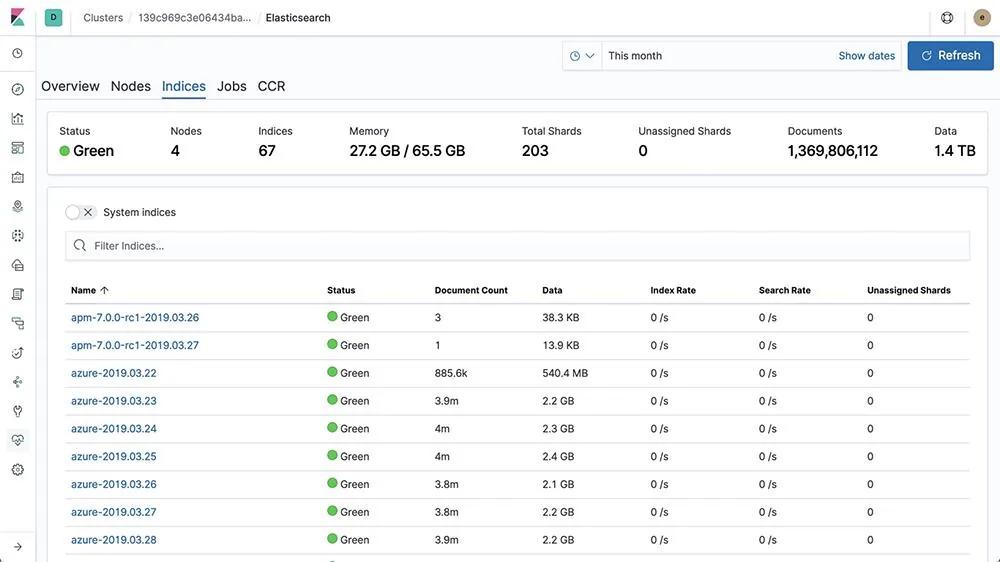
Manually polling the Cluster Health API works for troubleshooting, but production teams need continuous, automated visibility. A solid monitoring Elasticsearch cluster health setup typically includes:
- Scheduled polling of
_cluster/healthand_cluster/allocation/explain - Alerting thresholds tied to cluster health metrics, such as unassigned shard count or disk watermark breaches
- Historical trend tracking, so you spot slow degradation before it becomes a red status incident
- Correlation with infrastructure metrics like CPU, memory, and disk I/O
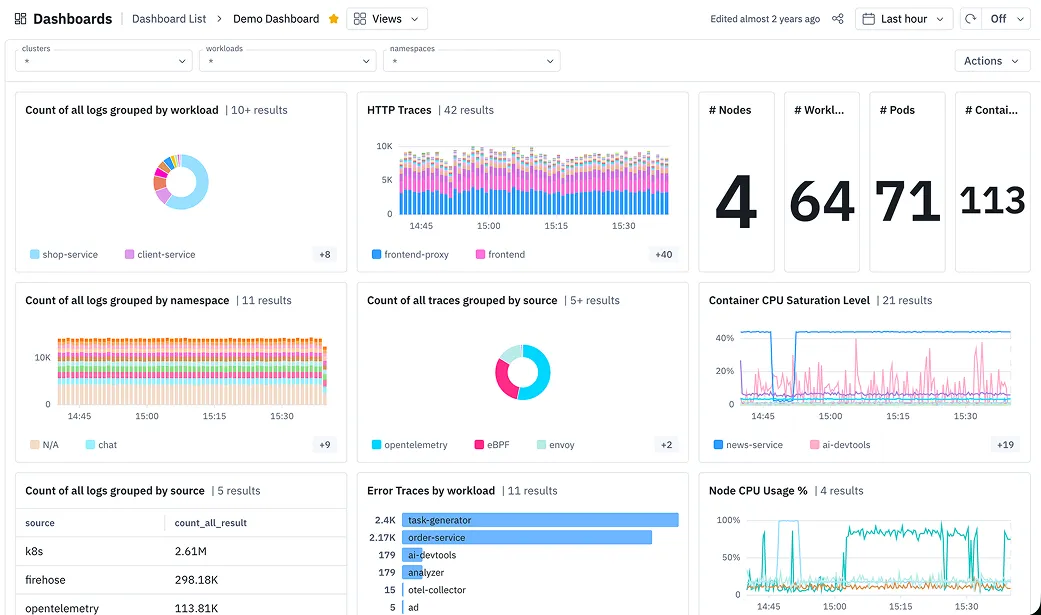
Source | Elasticsearch Monitoring
Elastic's built-in Stack Monitoring feature offers a starting point, but many teams outgrow single-purpose dashboards and move toward platforms that unify cluster health metrics with logs, traces, and infrastructure telemetry.
Best Practices for Maintaining Elasticsearch Index Health
Prevention is cheaper than incident response. The table below summarizes proven practices for keeping index health stable.
Consistently applying even a few of these practices reduces the frequency of index health incidents.
Elasticsearch Index Health Alerting and Anomaly Detection with groundcover
Manually checking cluster health metrics works until your cluster grows past a handful of indices, at which point teams need automated detection that catches problems before they cascade into outages.
groundcover's log management capabilities let you correlate Elasticsearch cluster logs with shard allocation events in real time, so a spike in unassigned shards doesn't get lost in unrelated log lines. Because groundcover's eBPF sensor requires no manual instrumentation, it picks up infrastructure monitoring signals like disk pressure and node resource exhaustion, two common root causes of yellow and red status, without code changes to your existing stack. For teams running Elasticsearch on containers, groundcover's Kubernetes monitoring support ties pod-level events directly to cluster health changes.
Getting started doesn't require a sales conversation. groundcover offers self-service sign-up with a 14-day trial that unlocks the full platform before downgrading to a permanent free tier, so you can start monitoring your cluster in your own cloud environment right away. Since groundcover runs inside your own AWS, GCP, or Azure environment through its BYOC architecture, your Elasticsearch data never leaves your infrastructure.
Conclusion
Elasticsearch index health is a small set of colors that carries a lot of operational weight. Green means your data is safe. Yellow warns that redundancy has slipped. Red means action is needed now. Knowing how these statuses are calculated, how to check them quickly, and how to fix the underlying causes turns what feels like an emergency into a routine part of running a resilient Elasticsearch cluster. Pair that knowledge with proactive monitoring, and index health stops being something you discover mid-incident and becomes something you manage on your own terms.
FAQs
Treat yellow health as actionable based on duration and lost redundancy rather than alerting on every transient shard relocation.
- Add a grace period for expected events such as rolling deployments, pod restarts, and node replacement so routine recovery does not page an engineer.
- Escalate persistent yellow states when unassigned replica counts stop decreasing or when another node failure would leave primary shards exposed.
- Track disk pressure, node availability, and shard recovery alongside health status so alerts describe likely causes instead of reporting only a color.
Discover our guide to Kubernetes alerting best practices.
Maintenance and scaling policies should preserve enough simultaneously available data nodes to satisfy shard-allocation rules while avoiding recovery storms that overload storage and network capacity.
- Set PodDisruptionBudgets from the actual failure tolerance provided by replicas rather than choosing
minAvailableindependently of Elasticsearch topology. - Before draining nodes, verify allocation awareness, free disk capacity, and whether remaining nodes can accept the displaced shards.
- Measure recovery throughput and duration before making node-downscaling aggressive; rapid scale-in can save compute while creating expensive shard movement and prolonged risk.
- Treat repeated health degradation during autoscaling as a capacity-policy problem, not merely an Elasticsearch alerting problem.
groundcover can bring Kubernetes events, infrastructure telemetry, and Elasticsearch-related application signals into the same troubleshooting workflow, reducing the manual correlation required when the shard health changes after infrastructure events.
- Start from the affected workload and compare the health transition with pod restarts, evictions, node pressure, and resource behavior.
- Check storage and node signals around the same time window rather than searching Elasticsearch and Kubernetes dashboards independently.
- Use Kubernetes context to determine whether recurring yellow states follow deployments, drains, autoscaling, or persistent-volume behavior.
- Preserve this correlation in monitors and dashboards so responders can reproduce the investigation during the next incident.
BYOC is useful when teams want observability over high-volume Elasticsearch workloads while keeping telemetry inside their own cloud environment rather than continuously exporting operational data to a SaaS backend.
- Evaluate observability architecture alongside Elasticsearch data-governance requirements, especially when logs may contain customer, security, or business-sensitive fields.
- Account for telemetry transfer and ingestion as part of total observability cost instead of comparing only license prices.
- Keep retention decisions closer to infrastructure and compliance controls when long-lived Elasticsearch telemetry is operationally valuable.
- Separate control-plane convenience from data-plane ownership when assessing observability vendors, particularly for regulated or high-volume environments.
Learn more about groundcover’s BYOC solution.