Grafana Dashboard No Data: Causes, Fixes & Best Practices



The whole point of Grafana dashboards is to make monitoring data easy to visualize – and so when your Grafana dashboards display a “no data” message, you have a problem. Fortunately, “no data” issues with Grafana dashboards are typically relatively easy to resolve. Doing so requires understanding the types of errors that can cause this problem, knowing how to identify them, and working through resolution steps.
Read on for guidance on all of the above as we unpack how to deal with Grafana dashboard “no data” issues.
What does “no data” mean in a Grafana dashboard?
When a Grafana dashboard displays a “no data” message, it means that Grafana couldn’t properly load the data for some reason (we’ll look at specific underlying causes of this problem in a moment). Consequently, the visualizations you’d normally see to help interpret data and identify trends are unavailable.
Common reasons why a Grafana dashboard shows no data
The underlying causes of the “no data” error in Grafana are usually one of the following:
- Incorrect time range selection: The dashboard may be querying a period for which no metrics, logs, or traces were collected. A common example that triggers this issue is selecting “Last 24 hours” when the application only started producing telemetry recently, or when data retention has removed older records.
- Incorrect query or filter configuration: Queries with incorrect metric names, labels, tags, variables, or filters may return no matching results. For example, filtering on a Kubernetes namespace or service label that does not exist will cause Grafana to display no data.
- Data source connectivity issues: Grafana may be unable to communicate with the underlying data source it’s configured to use (such as Prometheus, Elasticsearch, Loki or a cloud monitoring platform). Authentication failures when performing security verification, network problems, or incorrect data source settings are usually the root cause. Malicious bots can also sometimes disrupt connectivity by flooding networks with traffic.
- Missing or unavailable metrics: The expected metric may not exist because an exporter is not running, an application is not instrumented correctly, or a telemetry pipeline is failing. For example, a Prometheus dashboard will show no data if the target is not exposing the metric being queried.
- Failed metric collection or scraping: Monitoring systems may stop collecting data because of scrape failures, agent issues, exporter failures, or configuration problems. In Prometheus environments, targets that are down or unreachable can result in missing time series.
- Data source permissions or access problems: A user may have access to Grafana but not permission to query the underlying data source. Restricted roles, expired credentials, or incorrect API tokens can prevent data retrieval.
- Dashboard variables are misconfigured: Grafana dashboards often use variables for dynamic filtering, such as cluster names, namespaces, or service names. If a variable query returns no values or a default selection is invalid, panels depending on that variable may show no data.
- Time synchronization issues: Differences between system clocks, application timestamps and monitoring server time can cause data points to fall outside the selected query window. Incorrect time settings can make recently collected data appear to be missing.
- Retention or storage issues: Metrics, logs, or traces may have been deleted due to retention policies, storage limits, or database failures. A dashboard may show no data when the requested historical information is no longer available.
Grafana “no data” vs. null values vs. empty panels: What’s the difference
The “no data” message is just one of several data visualization errors that can occur in Grafana. Here’s a full list of issues you may encounter when data doesn’t display as expected in a dashboard:
- No data: This happens when Grafana receives no time series or records that match the query. It usually means the data source returned an empty result set, the metric does not exist, the query filters out all results, or the system is not collecting the expected telemetry. Grafana typically displays a “No data” message in this case because there is nothing to visualize.
- Null values: Null values occur when Grafana receives a time series, but one or more data points have missing values. A null value means the metric exists but does not have a value at a specific timestamp. This can happen when a metric stops being reported temporarily, a scrape fails, an application does not emit a value during a period, or a query produces gaps. Null values may cause Grafana to display gaps, connect points across missing values in a misleading way, or show configurable null-handling behavior, depending on panel settings.
- Empty panels: An empty panel refers to a visualization that renders without displaying useful information of any type, not even a clear error message. It can occur when a query returns no results, when all returned values are null, when panel transformations remove all data, or when visualization settings prevent data from being displayed. Unlike a dashboard showing the “no data” error, an empty panel may not clearly indicate the underlying cause.
Steps for diagnosing Grafana dashboards with no data
To diagnose and troubleshoot “no data” issues in Grafana dashboards, work through the following steps.
1. Check the time range and panel time window
Start by verifying that the dashboard and individual panel time ranges include the period when telemetry was collected. Grafana dashboards can use a global time range, but individual panels may override this setting with a custom time window that limits the query scope.
A “no data” message often occurs when the selected period is too narrow, points to a future time range, or falls outside the retention period of the underlying data source. To resolve the issue, expand the time range, or try a broader window (such as “Last 24 hours” or “Last 7 days”) and check whether data appears.
2. Test the query directly in the data source explorer
Run the panel query directly against the connected data source using Grafana’s Explore view or via the query inspector. This helps determine whether the issue is with the dashboard panel configuration or the underlying query itself.
If the query returns data in Explore or in the query inspector but not in the main dashboard, the problem is likely related to panel settings, transformations, variables, or visualization configuration. If the query also returns no results in Explore, the issue is more likely related to the data source, query logic, or missing telemetry.
3. Verify the data source connection and permissions
Confirm that Grafana can successfully connect to the configured data source and that the user or service account has permission to execute queries. Check the data source configuration for security service authentication failures, expired credentials, incorrect endpoints, or network connectivity problems.
In addition, in environments with role-based access control, ensure that the Grafana user has sufficient permissions to make verification successful when reading metrics, logs or traces from systems such as Prometheus, Elasticsearch or Loki.
4. Inspect the query for incorrect labels, filters or metric names
Review the panel query to ensure it references valid metric names, labels, tags and filters. A query may return no data when a metric has been renamed, a label value has changed, or a filter is too restrictive.
For example, a Prometheus query filtering for namespace="production" will return no results if the namespace does not exist or if the metric uses a different label name. Remove filters incrementally, confirm available label values, and validate that the query matches the telemetry schema.
5. Check whether the scrape target is active and returns data
Verify that the systems generating telemetry are running and successfully sending data to the monitoring backend. For example, in Prometheus environments, check whether scrape targets are healthy, reachable, and exposing the expected metrics. Failed scrapes, stopped exporters, application instrumentation issues, or collector failures can prevent new data from reaching Grafana.
Confirm target status, review scrape errors, and inspect recent samples to determine whether data collection is functioning correctly.
Grafana “no data” in Prometheus panels: Common query mistakes
When using Prometheus to collect data that you display in Grafana, oversights like the following may cause Grafana to show “no data”:
- Incorrect metric name: Prometheus queries depend on exact metric names, and a typo, outdated metric name, or renamed metric can cause Grafana to return no data. Use the Prometheus expression browser or Grafana Explore to confirm that the metric exists and matches the query.
- Incorrect label names: Prometheus labels are case-sensitive and must match the labels attached to the metric. A query filtering on app="frontend" will return no data if the metric uses a different label name such as service="frontend" or does not include the app label at all.
- Filtering on non-existent label values: A query may be syntactically correct but return no results because the selected label value does not exist. For example, filtering by namespace="prod" will return no data if the actual Kubernetes namespace is named production.
- Overly restrictive label filters: Combining too many label matchers can unintentionally exclude all time series. Start with a broad query such as http_requests_total and gradually add filters to identify which label condition removes the expected results.
- Incorrect use of label matchers: Prometheus supports exact matches (=), negative matches (!=), and regular expressions (=~, !~). Using the wrong matcher type or an incorrect regular expression can prevent expected series from being returned.
- Querying a metric that is not being scraped: A metric may exist in application code or an exporter configuration but not appear in Prometheus because the target is unavailable, scraping is disabled, or the metric is not exposed. Check the Prometheus targets page and confirm the metric has recent samples.
- Incorrect namespace, job or instance filters: Kubernetes and infrastructure dashboards often rely on labels such as job, instance, cluster or namespace. If these labels differ between environments or exporters, dashboard queries may return no data even though metrics are available.
Grafana “no data” in Loki log panels: What to check
When using Loki to generate data for Grafana, the underlying cause of seeing a “no data” message is typically one of the following:
- Incorrect LogQL query syntax: Loki queries use LogQL, which has specific syntax for stream selectors, filters, and parsing expressions. A typo in a label selector, invalid operator, or incorrect pipeline stage can cause a query to return no logs. To find and fix the syntax issue, test the query in Grafana Explore and simplify it step-by-step to identify where results disappear.
- Incorrect log stream labels: Loki relies heavily on labels to identify log streams. Queries that filter on labels such as namespace, Pod, app, or cluster will return no data if the labels do not match the ingested logs. Verify available labels and values in Explore before adding filters to dashboard queries.
- Overly restrictive label filters: Combining too many label matchers can unintentionally exclude all log streams. Start with a broad query such as {namespace="production"} and gradually add additional selectors to confirm which filter removes the expected results.
- Incorrect time range selection: In some cases, logs exist but fall outside the selected dashboard time window. Check both the global dashboard time range and any panel-specific time overrides. Expanding the range can help determine whether logs are missing or simply outside the query period.
- Logs not being ingested into Loki: A “no data” message may indicate that log collection has stopped before logs reach Loki. Check log agents such as Promtail, Grafana Alloy, or Fluent Bit to verify they are running, discovering log sources, and successfully sending entries to Loki.
How time range mismatches cause Grafana dashboard “no data”
As we’ve mentioned, the root cause of “no data” problems in Grafana dashboards frequently boils down to time range mismatches. Users may accidentally select a time range for which no data is available due to issues like:
- Requesting data from a time window that took place when the Grafana data collectors were not operating.
- Not realizing that the time zone used to track data is different from the one in which the user is working, leading to the selection of a time range for which no data exists.
- Time synchronization issues between a user’s device, data collectors, and/or Grafana, which could cause Grafana to “think” that data for the requested time range is not available.
How scrape interval and step settings affect Grafana data availability
Scrape intervals and step settings can also play an important role in determining whether Grafana data is available.
The scrape interval determines how frequently a monitoring system such as Prometheus collects metrics from targets. If a scrape interval is too long, metrics may appear sparse, delayed, or unavailable for short time windows in Grafana panels. For example, if Prometheus scrapes a target every five minutes and a Grafana panel is configured to display the last two minutes, the panel may show “no data” because no samples were collected during that period. Scrape failures, delayed collection, and changes to scrape configurations can also create gaps in the time series that appear as missing data in Grafana.
The query step setting controls the resolution of data points returned to Grafana when it queries a time series over a range. Grafana automatically adjusts the step based on the panel width and selected time range, but an inappropriate step value can hide available data or make trends appear inaccurate. A step that is too large may skip short-lived spikes or reduce the number of returned samples, while a step that is too small can overload the data source with unnecessary queries. To troubleshoot availability issues, ensure the Grafana time range is appropriate for the scrape interval, verify that the query step aligns with the metric collection frequency, and avoid using dashboard intervals that are shorter than the rate at which metrics are collected.
Fixing Grafana “no data” alerts that fire incorrectly
In some cases, you’ll receive a “no data” alert even when data is actually available. This typically happens due to alert rules that don’t distinguish between a true monitoring failure and a temporary lack of returned data.
To resolve the issue, start by reviewing the alert rule query and evaluation settings to confirm that the query returns the expected time series during normal operation. Check whether the alert condition is configured to handle missing data appropriately, since Grafana alerting can treat “no data” status as a firing alert, an OK state, or a separate NoData state depending on the rule configuration. You can also adjust the no data behavior to match the intended use case and add appropriate thresholds, evaluation windows, and pending periods to prevent brief gaps from triggering unnecessary alerts.
To prevent recurring false positives, verify the reliability of the underlying telemetry pipeline and alert query design. Confirm that the data source is available, metrics are being collected consistently, and scrape intervals or log ingestion delays are not creating temporary gaps. It also helps to use functions and conditions that account for missing samples, such as checking whether a metric exists before evaluating its value or using longer evaluation windows for intermittent data. In addition, monitor the health of collectors, exporters, and data sources separately so that a telemetry collection failure generates a targeted infrastructure alert rather than causing unrelated application alerts to fire.
Best practices for preventing Grafana dashboard “no data” errors
To get ahead of the issues that can cause “no data” errors in Grafana dashboards, consider the following best practices:
- Be strategic about dashboard design: When planning and creating dashboards, use validated queries, consistent metric names, and stable label structures to reduce the chance of panels returning no results. In addition, document the expected data sources, required metrics, and key labels used by each dashboard so changes to instrumentation or telemetry pipelines do not silently break visualizations.
- Use appropriate time ranges: Configure dashboards with default time windows that match the expected data collection frequency and retention policies. Avoid setting panels to very short time ranges when metrics are collected infrequently and use refresh intervals that balance data freshness with query load on the underlying data source.
- Monitor the health of telemetry pipelines: Track the availability of telemetry sources like Prometheus scrape targets, Loki ingestion components, OpenTelemetry collectors, and other telemetry agents that provide data to Grafana. Alert on missing metrics, failed scrapes, ingestion delays, and data source connectivity problems before they cause widespread dashboard gaps.
- Build dashboards that handle missing data gracefully: Configure panels and alert rules to distinguish between situations where there are actually zero values from those where data is missing and other types of failures. In addition, use appropriate no-data handling settings, avoid overly restrictive filters, and design queries that remain useful when individual services, Pods, or instances are temporarily unavailable.
Correlated observability that catches the root cause behind Grafana “no data” with groundcover
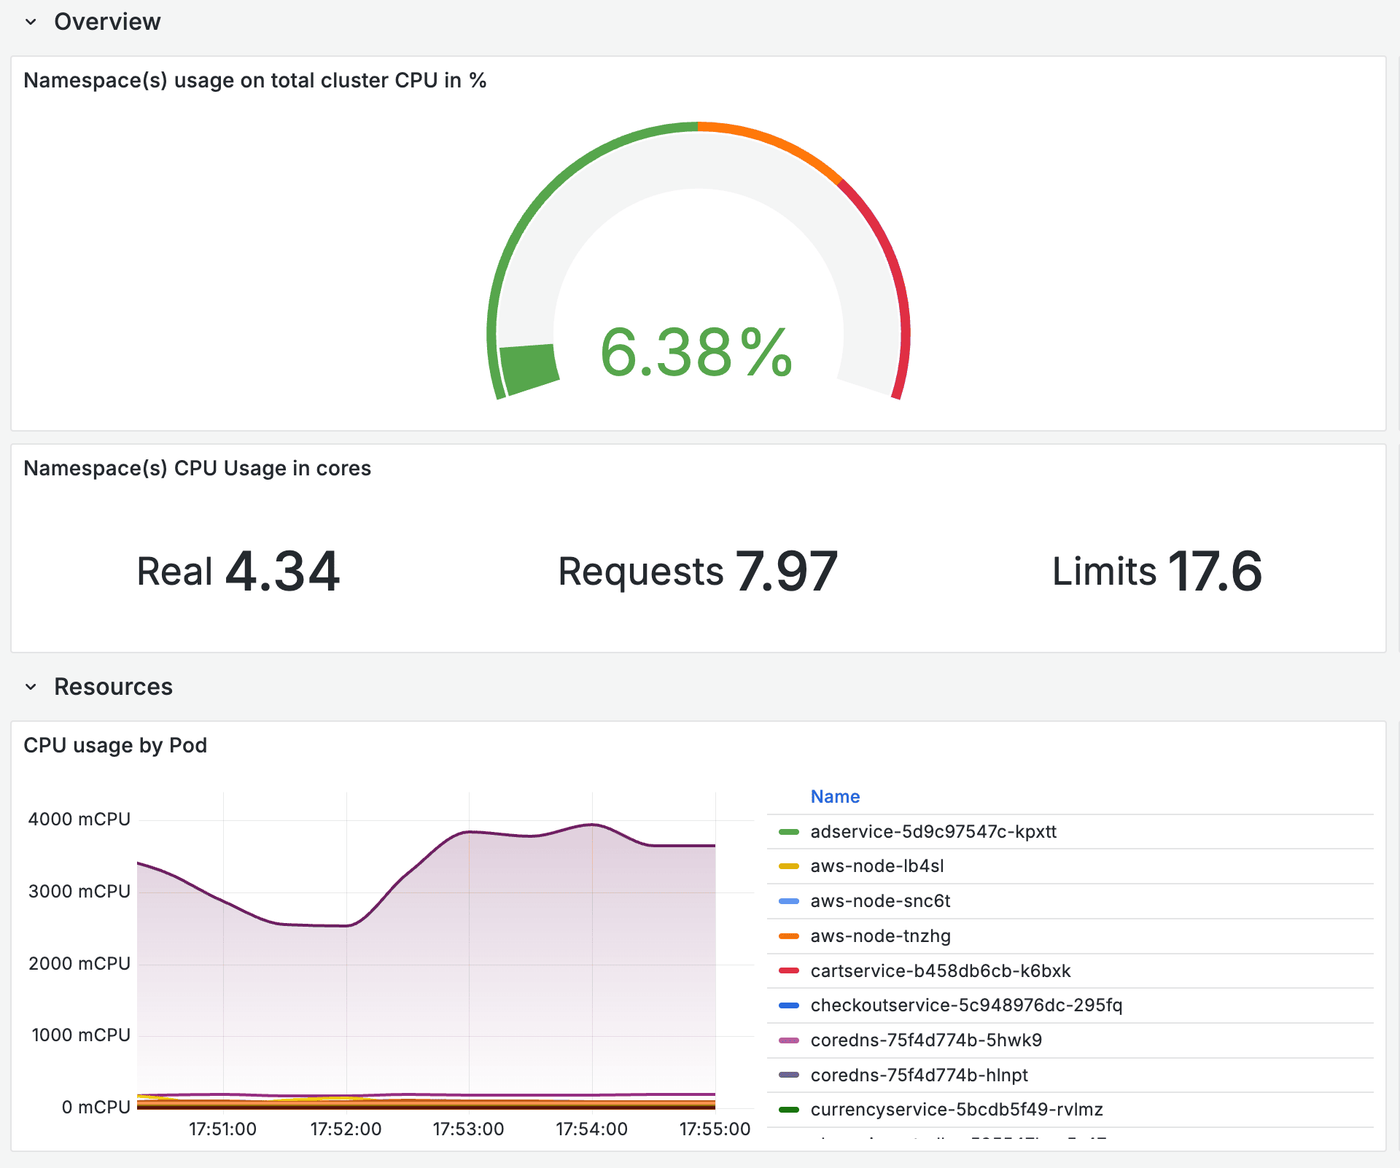
There are many potential causes of “no data” errors in Grafana dashboards, but there’s one comprehensive observability solution – groundcover – that will clue you into this issue and help you resolve it quickly.
By monitoring all of the infrastructure and components that power Grafana – including not just Grafana itself but also data collectors like Prometheus and Loki – continuously and in real time, groundcover alerts admins quickly to issues like server failures, Kubernetes runtime problems, storage exhaustion, and network disconnects that could break telemetry pipelines and trigger “no data” failures.
“No data” no more
The bottom line: If you want Grafana to do what it does best – create visualizations that help teams make sense of complex data – you need to ensure it can access the data it requires. Doing so depends on accurately configuring dashboards, as well as properly monitoring and managing data collectors and telemetry pipelines.
FAQs
Yes, a Grafana panel can show no data even when a metric exists in Prometheus. This typically happens if the query uses incorrect labels, filters, time ranges, variables, or transformations that prevent matching time series from being displayed.
Grafana alert no-data settings determine how missing query results affect alert evaluation and notification states. In contrast, panel visualization settings control how missing results are displayed to users in dashboards.
groundcover correlates Kubernetes runtime data, telemetry signals, and infrastructure health information to help identify whether missing metrics are caused by application or Pod failures, unavailable exporters, or failed metric collection targets.