Prometheus WAL: How It Works, Failures & Best Practices



Monitoring data is a terrible thing to waste – and thanks to the Prometheus Write-Ahead Log (WAL), the risk of losing metrics in Prometheus is minimal. That’s because WAL provides a safe place to store metrics data on disk before loading them into memory. If Prometheus crashes for some reason, the on-disk data will remain intact.
That said, WAL isn’t a perfect guarantee against metrics data loss in Prometheus. Configuration mistakes and lack of effective monitoring for Prometheus WAL itself could lead to situations where metrics aren’t saved or stored properly.
Read on for details about how to manage Prometheus WAL effectively as we explain what WAL does, how it works, and best practices for working with WAL in production.
What is Prometheus WAL?
Prometheus WAL (short for Write-Ahead Log) is a feature in Prometheus, the open source monitoring and alerting tool, that writes incoming metrics data to disk. Prometheus also stores metrics that the system is actively processing in volatile memory, or RAM. Since read/write speeds from memory are much higher, metrics stored in memory can be analyzed more quickly.
However, by writing metrics to disk via WAL, Prometheus creates backup copies of the data that remain accessible in the event of unexpected server failures. When the server is brought back up, metrics stored on disk can be recovered from the server’s WAL folder, even though any data that had been stored in memory would have been lost permanently when the server shut down.
How Prometheus WAL works
Here’s a deep dive into the key steps in the Prometheus WAL process
1. Write path: From scrape to WAL to TSDB block
First, Prometheus establishes a write path, which is the vector it uses to ingest metrics and store them. The write path begins when the server scrapes metrics from configured targets at scheduled intervals. Each scrape collects the current values for all exposed metrics, attaches labels and timestamps, then prepares the samples for ingestion.
Before the data is written to the time-series database (TSDB), Prometheus first appends every new sample to the WAL by adding it to the WAL files (which are stored in the wal/ directory). Writing to the WAL provides a durable record of incoming data, ensuring that recently collected metrics can be recovered if the Prometheus process or host crashes before they are permanently stored.
Once the samples have been safely recorded in the WAL, copies are written to the in-memory TSDB head block, where they become immediately available for queries and alert evaluations.
As the head block accumulates data, Prometheus periodically compacts it into immutable TSDB blocks stored on disk. These blocks are optimized for long-term storage and efficient querying, while the WAL continues capturing newly arriving samples until they, too, are compacted into future blocks.
2. WAL segments, checkpoints, and rotation
Rather than storing all write-ahead log entries in a single file, Prometheus divides the WAL into sequential segment files of fixed size. As one segment fills, Prometheus automatically creates the next segment and continues writing without interrupting ingestion. This segmented design limits the size of individual files, simplifies recovery, and allows older data to be removed independently once it is no longer needed. Each segment contains a chronological record of samples, series definitions, and metadata that are required to reconstruct the in-memory database after admins restart Prometheus.
To prevent the WAL from growing indefinitely and exhausting available disk space, Prometheus periodically creates checkpoints and rotates older segments via a process known as WAL truncation. A checkpoint captures the current state of active time series so that recovery does not require replaying every historical WAL record. After the corresponding data has been compacted into persistent TSDB blocks and is no longer needed for recovery, obsolete WAL segments are deleted. This combination of segmentation, checkpointing, and rotation reduces storage consumption while keeping restart times manageable, even for large deployments.
3. How Prometheus replays the WAL on restart
After a Prometheus restart following an unexpected shutdown or planned power cycle, it first loads the existing TSDB blocks stored on disk. Then, it examines the WAL to identify any samples that were successfully written to the log but that had not yet been compacted into permanent storage. By replaying these records in chronological order, Prometheus is able to reconstruct the in-memory head block and restore recently ingested time series that would otherwise have been lost. The replay process also restores metadata such as series definitions and label mappings required to interpret the stored samples correctly.
Total recovery time depends on factors such as the size of the WAL, the number of active series, and the amount of data that accumulated since the last checkpoint.
After replay completes, Prometheus resumes normal operation, continuing to scrape targets, append new samples to the WAL, and periodically compact the head block into immutable TSDB blocks.
WAL vs. TSDB blocks: How they work together
As mentioned above, WAL works in conjunction with the Prometheus time-series database (TSDB) to help ensure the reliable, efficient processing of monitoring data.
When Prometheus scrapes metrics from monitored targets, each new sample is first written to the write-ahead log (WAL), creating a persistent record that protects recently ingested data from being lost if the server crashes. After the sample is safely recorded in the WAL, it is then stored in the in-memory TSDB head block, where it becomes immediately available for queries and alerting.
As the head block fills, Prometheus periodically compacts its contents into immutable TSDB blocks on disk that are optimized for fast querying and storage efficiency. Once successful data compaction is complete, the corresponding WAL entries can be checkpointed and eventually removed. This allows the WAL to continue recording only newly arriving samples while the TSDB maintains the permanent historical dataset.
Common Prometheus WAL failures and how to fix them
Although the WAL capability is designed to boost data reliability in Prometheus, problems can arise that prevent WAL from working correctly. Here’s a look at common WAL issues.
WAL corruption on crash or disk failure
There is a risk that data stored on disk will become corrupt, especially following “hard” shutdown events where the Prometheus server operating system doesn’t have time to pause file system operations before turning off. This can lead to corrupted WAL segments.
Because the WAL records every sample before it is added to the TSDB head block, corrupted segments can prevent Prometheus from reading the complete history of recently ingested data. In some cases, only the affected samples are lost, while more severe corruption may prevent Prometheus from completing startup.
Administrators typically resolve the issue by removing the corrupted WAL segments, although this sacrifices any uncommitted data that had not yet been compacted into permanent TSDB blocks. It may also be possible to repair the file system using tools like fsck, then recover the segments that were corrupted.
WAL replay errors on startup
Whenever Prometheus starts, it replays the WAL to rebuild the in-memory head block with samples that were not yet compacted into TSDB blocks. Replay errors occur when Prometheus encounters invalid records, truncated segments, incompatible data, or corrupted metadata while processing the WAL. These errors may prevent the server from completing recovery or leave recently collected metrics unavailable.
Diagnosing replay failures typically involves examining startup logs to identify the affected WAL segments and determining whether the problem stems from storage corruption, interrupted writes, or version incompatibilities before repairing or removing the damaged files.
Disk space exhaustion from WAL growth
The WAL is designed to grow continuously as Prometheus ingests new metrics, and if it gets too big, it can eventually consume all available disk space. This tends to happen if old WAL segments can’t be checkpointed and removed to free up space, and is often triggered by unusually high ingestion rates, excessive metric cardinality, delayed block compaction, or storage capacity that is too small for the workload.
Once the disk becomes full, Prometheus can no longer write new WAL entries. This causes metric ingestion to fail, which can in turn undercut alerting and monitoring accuracy. To prevent disk exhaustion, monitor WAL size, control metric volume, and ensure sufficient storage capacity for expected retention and ingestion rates.
Slow WAL replay causes extended recovery time
The amount of time required to replay the WAL increases with the volume of uncommitted data, the number of active time series, and the performance of the underlying storage. Large environments with millions of series or high ingestion rates may accumulate substantial WAL data between checkpoints, resulting in lengthy startup times after a restart.
During replay, Prometheus can’t resume normal scraping until recovery completes, leading to extended monitoring gaps and delayed alert evaluations.
Reducing replay time usually involves optimizing storage performance, limiting unnecessary metric cardinality, increasing checkpoint frequency through normal compaction, and minimizing the amount of WAL data that must be processed after a restart.
How to configure and tune the Prometheus WAL
Maximizing the efficiency and reliability of Prometheus WAL requires making the right configuration choices. Key steps include:
- Configure storage and WAL location: When selecting the storage device and file system that will back WAL data, choose fast, reliable storage with sufficient free capacity to handle continuous writes and accommodate both WAL segments and TSDB blocks as metric volume grows.
- Tune metric ingestion and cardinality: Reduce unnecessary metric cardinality by eliminating unused labels, aggregating metrics where appropriate, and optimizing scrape intervals to minimize WAL growth and disk I/O.
- Configure retention and compaction settings: Set appropriate data retention policies so Prometheus can efficiently compact the TSDB head block into immutable blocks, create checkpoints, and remove obsolete WAL segments. You can also enable WAL compression (using the CLI flag --storage.tsdb.wal-compression) to save WAL storage space.
- Monitor WAL health and performance: Continuously track WAL size, segment count, replay duration, disk utilization and storage latency, and configure alerts for abnormal growth, low disk space and slow recovery.
- Test recovery and validate configuration: To avoid surprises in the event that you need to recover data from WAL, perform controlled Prometheus restart tests. These allow you to verify successful WAL replay, measure recovery times, and confirm that configuration settings continue to meet performance and availability requirements.
How to monitor the Prometheus WAL
Monitoring the Prometheus WAL is critical for detecting and remediating issues that could prevent reliable metric ingestion, slow recovery following a restart, or lead to wasted storage space.
To monitor WAL, you can track Prometheus internal metrics alongside infrastructure and storage data. Key metrics include:
- WAL size
- The number of WAL segments
- WAL replay duration
- TSDB compaction activity
- Disk space utilization
- Storage latency
- Disk I/O
Prometheus WAL in Kubernetes: Storage and permission considerations
If you deploy Prometheus in a Kubernetes cluster, you’ll need to contend with some extra complications, due to the added complexity that Kubernetes brings in the realm of storage and permissions management.
Key considerations include:
- Persistent volume usage: To ensure the reliability of WAL data, you’ll want to store it using a Kubernetes persistent volume, rather than relying on ephemeral container storage. Otherwise, you will lose the data permanently following a container restart.
- Permissions management: Prometheus needs to be able to create, update, and delete WAL segments as part of normal operation. To this end, you’ll want to configure Kubernetes security settings (including file ownership, securityContext, runAsUser, runAsGroup and fsGroup) to grant the Prometheus process write access to the mounted volume.
Best practices for Prometheus WAL management in production
To maximize the reliability and efficiency of WAL, consider the following best practices:
- Use fast, reliable storage: Store the WAL on reliable, low-latency persistent storage with sufficient capacity to support continuous writes, efficient replay, and predictable growth under peak ingestion workloads.
- Control metric cardinality and ingestion volume: Reduce unnecessary labels, remove unused metrics, and optimize scrape intervals to limit WAL growth, decrease disk I/O, and improve recovery times after restarts.
- Monitor WAL and storage health proactively: Don’t wait for a problem to occur to detect an issue with WAL. Instead, track WAL size, segment count, replay duration, TSDB compaction, disk utilization and storage latency. You can also configure alerts to detect abnormal growth, failed compactions or low disk space before they impact monitoring.
- Regularly test recovery procedures: Perform controlled Prometheus restarts to verify successful WAL replay, measure recovery times and validate that storage, retention and WAL configuration continue to meet production performance and availability requirements.
WAL and storage health monitoring across Prometheus with groundcover
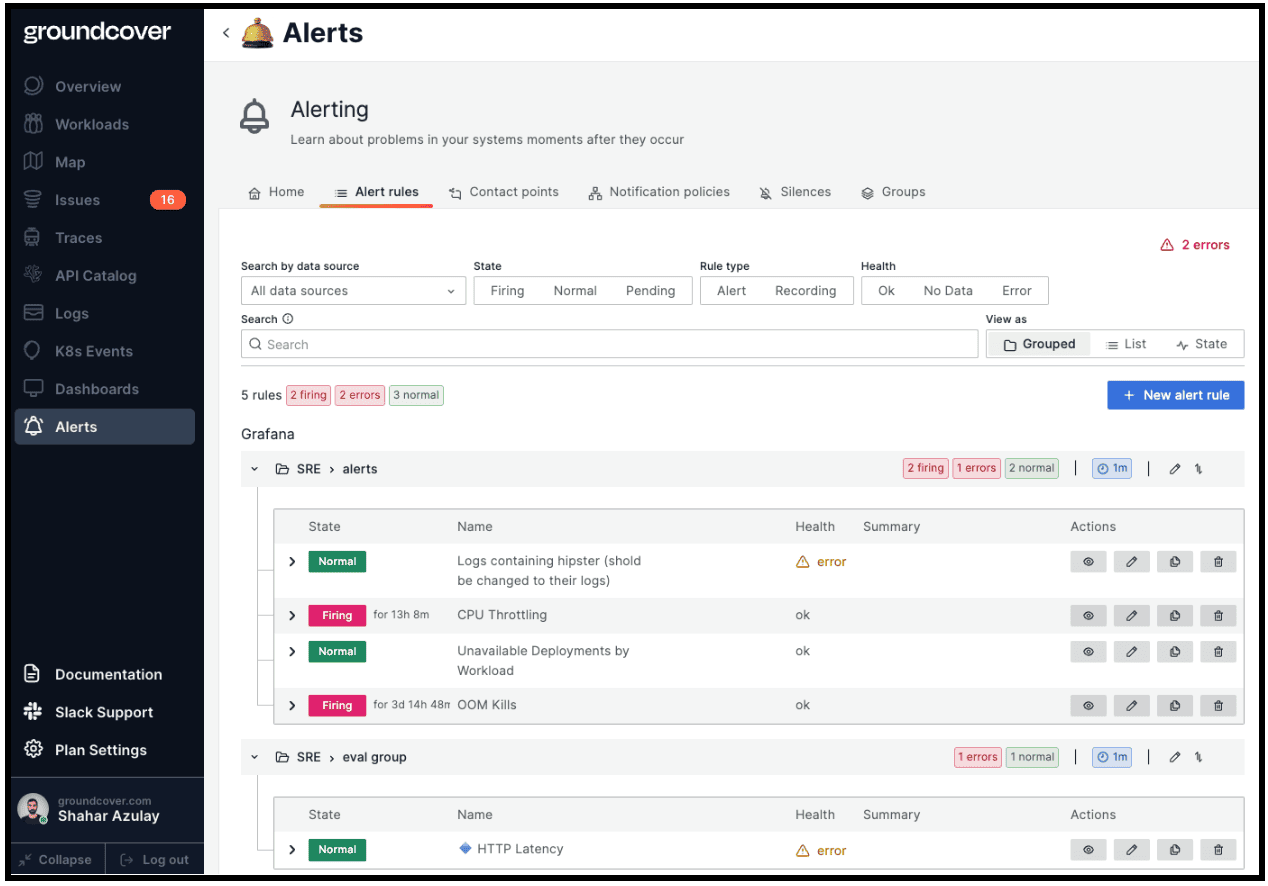
With groundcover, you never need to guess at the health of WAL or the storage systems that support it. That’s because groundcover provides continuous, real-time visibility into the status of all Prometheus infrastructure components – including the disks and storage systems where WAL data lives.
What’s more, groundcover also helps surface insights – such as long-term storage utilization trends – that admins can use to optimize Prometheus storage performance over time. It also delivers a host of complementary contextual data, like CPU and memory utilization by Prometheus servers, to help optimize overall Prometheus speed and efficiency.
May your back never be up against the WAL
Prometheus WAL is a handy, built-in feature that helps ensure you don't lose critical monitoring insights. But like any software capability, it's only as reliable as the management and monitoring process built around it. Hence the importance of ensuring that you keep track of WAL's health and performance and get ahead of issues that could lead to data loss.
FAQs
A partial recovery is possible. Typically, only the corrupted WAL segments need to be removed or repaired rather than wiping the entire TSDB; however, any data contained exclusively in those damaged segments may be lost.
The WAL serves as the source of data for both local TSDB persistence and remote write. Replaying the WAL after a restart restores the state of Prometheus local storage without duplicating metrics that have already been successfully sent to the remote storage backend.
groundcover continuously monitors Prometheus and Kubernetes telemetry to surface indicators such as WAL replay duration, storage utilization, and disk pressure. It makes this information accessible through automated dashboards, alerts, and correlated infrastructure insights to help admins identify and diagnose issues quickly.