Prometheus Remote Write: Architecture, Examples & Troubleshooting


Over the last decade, Prometheus has become the de facto tool in the world of operational monitoring. Given its broad adoption, it has a growing ecosystem of components that allow users to scrape, store, and visualize data.
However, as organizations scale and adopt more dynamic infrastructures, they frequently encounter limitations: you need to analyze historical data from a few months back, but your local Prometheus instance only stores a short window. Or, you are running Prometheus across multiple clusters, and the friction of switching between them slows down investigations.
At some point, you might need historical data for long-term comparisons, only to realize the older data has already been rotated out. This is where Prometheus Remote Write comes into play. It offers a powerful mechanism to extend Prometheus's capabilities, enabling long-term storage, global visibility, and seamless integration with external systems.
What is Prometheus Remote Write?
Prometheus instances operate by default on a pull model, meaning that a standard Prometheus server scrapes metrics from configured targets. Interestingly, one Prometheus instance can even be configured to scrape metrics from another Prometheus instance, essentially acting as a collection point.
However, scraping alone isn't enough for all scaling demands, especially when you need to send data to a different type of system, such as a long-term, scalable database or a dedicated, centralized observability platform. Prometheus Remote Write solves this problem. Remote Write is a core feature that allows a Prometheus server to forward its collected metrics to another external system, commonly referred to as a "remote endpoint." This endpoint is typically a long-term storage solution, a global Prometheus setup (such as Thanos or Cortex), or a specialized analytics platform. Instead of relying purely on local storage or another scraper pulling data, the Prometheus server initiates a push action, acting as a collection and forwarding agent that sends its scrape results to an external system for persistent storage and distributed querying.
Remote Write vs. Remote Read
It's important to distinguish between Remote Write and Remote Read:
While complementary, Remote Write is often the first step in building a scalable monitoring architecture, as it addresses the fundamental challenge of extracting metrics from individual Prometheus instances and into a more centralized, persistent store.
How Prometheus Remote Write Works
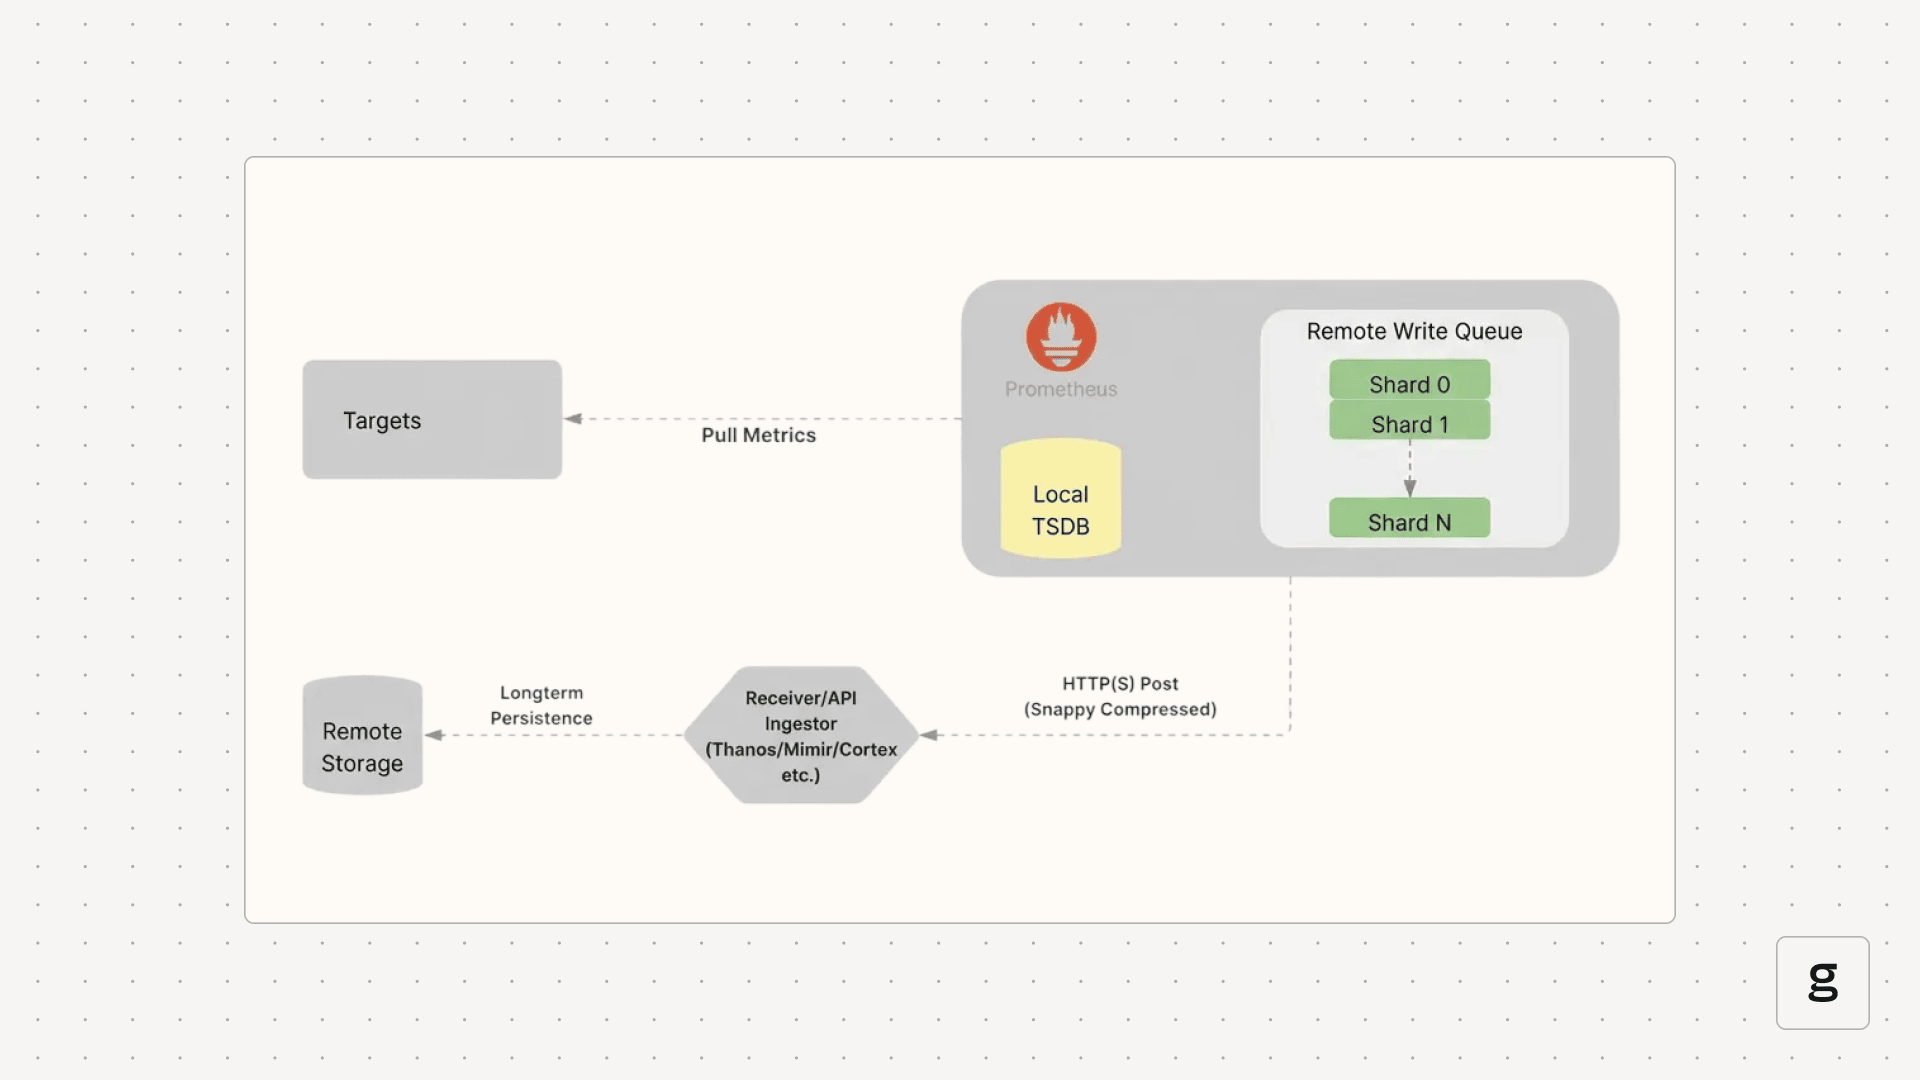
Remote write functionality operates by intercepting time series samples immediately after they are scraped and written to the local Time Series Database (TSDB). These samples are then placed into an in-memory queue, which is internally managed as a set of concurrent worker threads, often referred to as "shards”. To ensure that metric data remains correctly ordered, all samples belonging to the same unique time series (defined by its metric name and complete set of labels) are routed strictly to the same shard.
Why You Need Prometheus Remote Write
Using remote write addresses several critical challenges in large-scale monitoring environments, such as follows:
- Long term Storage: Local Prometheus instances typically have a "use it or lose it" policy for data, often deleting anything older than a few weeks to conserve disk space. Remote Write lets you ship that data to backends built for the long haul. This means you can run year-over-year reports or review old incidents without hitting a storage limit.
- Unified Dashboard: When you're running dozens of clusters, checking each Prometheus instance individually is a nightmare. By consolidating everything into a central hub, you gain a "Global View." This allows you to build dashboards that display your entire infrastructure in one place, making it easier to identify trends across different regions or environments.
- Scalability & High Availability: A single Prometheus instance can become a bottleneck. By using Remote Write to feed data into a distributed, highly available remote storage system (like Cortex, Thanos, or Mimir), you can achieve greater scalability and resilience for your monitoring infrastructure.
- Integration with Other Systems: Remote Write can act as a bridge to other data analysis platforms, data lakes, or incident response systems that can consume Prometheus metrics for advanced analytics, machine learning, or automated alerting, providing capabilities beyond what a local Prometheus can offer.
- Lighter Local Footprint: Since the local Prometheus doesn't need to store months of data, it can run more efficiently. This reduces "disk pressure" and allows the server to focus on its primary task: scraping targets quickly and accurately. It makes your edge instances much more stable and easier to manage.
Prometheus Remote Write Specifications and Protocol Basics
The Prometheus community defines the Remote Write protocol to ensure compatibility between Prometheus servers and various remote storage backends. The official Prometheus documentation defines the following two versions of this specification:
- Prometheus Remote Write Specification V1: This is the current, stable, and widely adopted specification that dictates the required format and transport for all compatible remote storage systems.
- Prometheus Remote Write Specification V2: This specification is currently in an experimental phase. It is being developed to introduce improvements in areas like metadata handling and series management. Remote storage implementations must adhere to V1 for guaranteed compatibility today.
The following table describes the established V1 protocol as defined in the official Prometheus specification:
Common Prometheus Remote Write Configurations
Remote write is configured within the remote_write block in the prometheus.yml file. You can configure multiple remote write endpoints.
In the above example, Prometheus remote write is set up to ship metrics directly to a Thanos Receiver. Instead of sending every single data point, the configuration uses a keep rule to ensure only the "my-app” service data is forwarded, preventing your central storage from getting cluttered with irrelevant metrics.
Tuning Prometheus Remote Write for Your Environment
Configuring what to send is only half the battle; you also need to manage how it gets there. This is handled by the "queue_config” block, which sits inside the "remote_write” definition. If you don't tune these settings, a high-volume Prometheus instance can easily overwhelm its own memory or fall behind, resulting in "gaps" in your remote data.
How the Queue Works
When Prometheus scrapes a target, the data doesn't immediately hit the network. Instead, it follows a specific path through an internal subsystem:
- The WAL: Samples are first written to the local Write-Ahead Log (WAL) to ensure they aren't lost if the process crashes.
- Sharding: Prometheus reads from the WAL and hashes each unique time series. All samples for a specific metric are sent to a designated "shard" (an internal worker thread). This ensures that data for a single metric stays in the correct chronological order.
- Batching: Each shard acts as a small buffer. It waits until it has collected enough samples to fill a batch or until a specific time limit is reached.
- Compression and POST: Once a batch is ready, Prometheus compresses it using Snappy and sends it to the remote endpoint via an HTTP POST request.
Note that if a single shard backs up and fills its queue, Prometheus will block reading from the WAL into all shards. While Prometheus retries failed sends with exponential backoff, data will eventually be lost if the remote endpoint remains unavailable longer than the local WAL retention period (defaulting to 2 hours).
Key Parameters
The following shows an example of the queue_config block in prometheus.yml.
Here is a breakdown of what these specific parameters control:
- capacity: This is the number of samples each shard can hold in memory. It is recommended to keep this between 3 to 10 times your max_samples_per_send. Setting it too high can cause excessive memory usage and longer recovery times during resharding.
- max_shards: This defines the maximum parallelism for outgoing requests. Prometheus automatically scales shards based on the incoming data rate, but you may need to reduce this if the remote endpoint is being overwhelmed or if your Prometheus server is running out of memory.
- min_shards: This sets the starting number of workers. While Prometheus scales up automatically, increasing this can prevent it from falling behind right at the start before the auto-scaling kicks in.
- max_samples_per_send: This is your batch size. Increasing this can make the network more efficient, but some backends have limits on how large a single request can be. The default (2000) is a safe bet for most systems.
- batch_send_deadline: This is a fallback timer. Even if a shard isn't full, it will send its batch after this time limit, ensuring your remote data stays "fresh."
- min_backoff and max_backoff: These control the retry logic. When a send fails, Prometheus waits for the min_backoff time and doubles it for every subsequent failure until it reaches max_backoff.
Common Use Cases for Prometheus Remote Write
Prometheus Remote Write transitions your monitoring from a local utility to a global observability platform. Here are the most common scenarios:
- Centralized "Global View": When running multiple clusters, it's a pain to jump between different Grafana data sources. Remote Write ships metrics from every cluster to a central backend, such as Thanos or Mimir, allowing you to visualize your entire infrastructure on a single dashboard.
- Long-Term Retention: Local Prometheus storage is typically limited to a few weeks to maintain disk performance. Remote Write allows you to archive months or years of data in cost-effective object storage (S3/GCS) for compliance, audits, and historical trend analysis.
- Handling High Cardinality: Metrics with thousands of unique label combinations (such as per-user IDs) can cause a local Prometheus to crash. Offloading this data to a horizontally scalable backend protects your scraper while still allowing deep-dive analytics.
- Hybrid and Multi-Cloud Monitoring: It acts as a secure bridge for hybrid setups. You can run lightweight collectors on-premise that "push" metrics to a managed cloud service, giving you a unified view of both environments without complex networking.
- Capacity Planning: Long-term data is essential for predicting future resource needs. Remote Write feeds historical streams into specialized platforms for capacity planning and machine learning, helping you spot growth patterns that short-term local data would miss.
Troubleshooting Prometheus Remote Write Issues
Even with a perfect configuration, "silent failures" can occur because Remote Write operates as a background process. If your dashboards are empty or showing gaps, your first step should be checking the Prometheus server logs and its own internal metrics.
Key Metrics to Watch
Prometheus provides built-in metrics to track the health of its remote write queues. You can query these in your local Prometheus expression browser:
- prometheus_remote_storage_samples_total: The total number of samples sent. This is the 'heartbeat' metric. If this isn't increasing, no data is leaving the system.
- prometheus_remote_storage_samples_dropped_total: This is critical. This is the 'red alert' metric. If this is increasing, your queue is full and you are losing data. This usually happens because the remote endpoint is down or too slow.
- prometheus_remote_storage_highest_sent_timestamp_seconds: Subtracting this from the current time will tell you the "lag”. If the lag is growing, your Prometheus is collecting data faster than it can ship it.
- prometheus_remote_storage_retries_total: A high number of retries suggests transient network issues or the remote backend is struggling to keep up.
Common Error Messages in Logs
When you see errors in the Prometheus logs (typically starting with msg="Error sending samples to remote storage"), they usually fall into these categories:
- 429 Too Many Requests: You are being rate-limited. This often happens with managed services or multi-tenant Thanos/Mimir setups.
- Fix: Check the ingestion limits on your remote store or use write_relabel_configs to drop high-cardinality metrics.
- Context Deadline Exceeded: The remote store didn't acknowledge the data within the remote_timeout window (default 30s).
- Fix: This is often a sign of network latency or a slow backend disk. Try increasing remote_timeout or check the health of your remote receiver.
- "401 Unauthorized” or "403 Forbidden”: There is an issue with your credentials.
- Fix: Verify your bearer_token_file or basic_auth password and ensure your TLS certificates haven't expired.
Queue Saturation and Memory Issues
If your Prometheus server is crashing with "Out of Memory" (OOM) errors after enabling remote write, the queue might be too large.
- Fix: Each shard uses memory. If you have "max_shards” set very high alongside a large capacity, memory usage can spike during network outages as the buffer fills up. Lower your "max_shards” or capacity to stabilize the memory footprint.
Related Technologies for Prometheus Remote Write
Prometheus Remote Write acts as a universal bridge, allowing a standardized flow of data between local scrapers and the broader observability ecosystem.
Long-Term Storage Backends
These systems provide the horizontal scale and durability that a single Prometheus instance lacks:
- Thanos: Uses the Receiver component to ingest data and store it in long-term object storage (S3/GCS).
- Grafana Mimir / Cortex: Scalable, multi-tenant databases designed to handle billions of series across many "ingester" nodes.
- VictoriaMetrics: A high-performance, cost-effective alternative focused on storage efficiency and low resource usage.
Managed Cloud Services
For teams that prefer not to manage backend infrastructure, major cloud providers offer compatible endpoints:
- Amazon Managed Service for Prometheus (AMP)
- Google Cloud Managed Service for Prometheus
- Azure Monitor managed service for Prometheus
Collectors and Pipelines
Intermediaries that process data before it reaches its final destination:
- Prometheus Agent Mode: A lightweight version of Prometheus with local storage disabled, built specifically to scrape and forward metrics.
- OpenTelemetry Collector: Receives Remote Write data to transform, enrich, or route it to multiple platforms simultaneously.
- Observability Pipelines (Vector/Fluent Bit): Act as high-speed routers that can filter and transform metric streams in transit.
Steps to Set Up and Test Prometheus Remote Write
To verify the Remote Write setup, you can use the following steps:
- To get Prometheus Remote Write up and running, first ensure that you can communicate with your remote endpoint and that your API tokens or Basic Auth credentials are valid. You'll then need to set up a "remote_write” block into your "prometheus.yml” file. Just double-check the URL and ensure you've mounted any secret files required for authentication, so you aren't leaving passwords in plain text.
- After you've reloaded the config, keep an eye on the Prometheus logs for any immediate connection blips.
- If the numbers are increasing, data is being moved. If your metrics appear with all their labels intact, you're all set.
Unified Control & Stability with groundcover
As your infrastructure scales, managing dozens of individual remote_write configurations becomes an operational burden. groundcover redefines this by leveraging eBPF (Extended Berkeley Packet Filter) to collect metrics with virtually zero overhead. This removes the need for traditional sidecars and complex scraper tuning while providing a high-performance ingestion layer.
Scaling Without the Tuning
In a standard setup, a sudden spike in high-cardinality metrics can cause a local Prometheus instance to crash or result in the remote write queue falling behind. groundcover uses a specialized metrics-ingester that acts as a "smart buffer." This layer automatically handles ingestion spikes and manages metric cardinality so you don't have to manually tune shards or batch sizes every time your environment grows.
Streamlined Integration
Integration is designed to be as low-friction as possible, depending on where your data lives:
- In-Cluster (Kubernetes): You can write directly to the local groundcover sensor service. This eliminates the need to manage ingestion keys or route traffic over the public internet. You point Prometheus to the internal sensor endpoint: https://{GROUNDCOVER_SENSOR_ENDPOINT}/api/v1/write.
- External Sources: For standalone hosts or non-Kubernetes environments, you can ship metrics to your InCloud site. By adding custom headers, such as x-groundcover-service-name or x-groundcover-env-name, to your remote_write config, your data arrives pre-labeled and organized within the groundcover dashboard.
Why It Works Better
Managing Remote Write at scale often leads to 'tuning fatigue.' When a sudden spike in high-cardinality metrics occurs, a standard Prometheus instance might crash or see its queue fall behind. groundcover eliminates this manual intervention by providing an eBPF-powered ingestion layer that scales automatically. By acting as a 'smart buffer,' groundcover handles ingestion spikes and manages metric cardinality without requiring you to manually adjust shard counts.
Furthermore, because groundcover operates on a node-based pricing model, you can increase the granularity of your remote write data without the fear of 'bill shock' from ballooning data-point-per-minute costs. This creates a predictable environment where historical data is always available, secure within your own infrastructure, and correlated directly with logs and traces via a single, unified view.
Conclusion
Prometheus Remote Write is the link that turns local monitoring into a global observability strategy. By moving data beyond a single server, you gain a unified view of your entire infrastructure and the long-term storage needed for audits and historical trends. A solid setup is all about striking a balance between control and simplicity. While manual tuning of shards and batching helps optimize traffic, platforms like groundcover remove that operational stress by providing an ingestion layer that scales automatically. This allows you to focus on the data itself rather than the plumbing, all while keeping your metrics secure inside your own cloud. Mastering this connection ensures that your monitoring remains reliable and cost-effective as your environment expands.
FAQs
How can I reduce bandwidth and storage costs when using Prometheus Remote Write at scale?
Optimizing Remote Write costs requires reducing the volume of data sent and increasing the efficiency of the network transport:
- Drop Low-Value Data: Use write_relabel_configs to drop specific metrics or high-cardinality labels (like unique session IDs) before they leave your cluster, ensuring you only pay to store useful data.
- Adjust Scrape Intervals: Increasing the scrape_interval for non-critical services is a high-impact way to lower the total volume of data points generated and shipped.
- Optimize Batch Sizes: Tuning max_samples_per_send to create larger batches reduces the overhead of repeated HTTP headers, making your network bandwidth utilization much more efficient.
- Disable Exemplars: Unless you specifically require them for correlating metrics with traces, disable send_exemplars to remove extra weight from every request payload.
What are the best practices for securing Prometheus Remote Write traffic across distributed environments?Securing metrics in transit and at the ingestion point is essential for maintaining the integrity of your observability data:
- Encrypt Data in Transit: Always use TLS/HTTPS for your remote write URLs to ensure that sensitive metric labels (which might contain service names or metadata) are encrypted during transport.
- Secure Authentication: Avoid hardcoding API keys or passwords in prometheus.yml. Instead, use bearer_token_file or basic_auth with credentials mounted as Kubernetes Secrets or external files.
- Restrict Network Access: In multi-tenant or distributed environments, use Network Policies or firewalls to whitelist only the specific IP ranges of your authorized Prometheus instances.
- Validate Certificates: Ensure your tls_config is properly configured with valid CA certificates to prevent man-in-the-middle attacks when communicating with external endpoints.
How does groundcover optimize or replace the need for complex Prometheus Remote Write pipelines?
groundcover eliminates the operational burden of manual "plumbing" by providing a managed ingestion layer that prioritizes performance and stability:
- Automated Pipeline Management: It provides a high-performance metrics-ingester that sits in your own cloud, automatically handling the sharding, buffering, and batching that usually requires manual queue_config tuning.
- Cardinality Control: The system utilizes eBPF for data collection and includes built-in cardinality management to prevent a sudden spike in labels from crashing your monitoring infrastructure.
- Node-Based Pricing Model: By decoupling costs from "data points per minute" and moving to a node-based model, groundcover removes the financial penalty usually associated with shipping high-resolution metrics.
- SaaS-Free Architecture: Because the ingestion occurs within your own cloud perimeter, you eliminate the massive bandwidth costs and security risks of sending sensitive metric streams to a third-party provider.


.svg)