Prometheus Federation Explained: Architecture & Pitfalls


Prometheus is easy to work with when one server scrapes one cluster and stores all the metrics. Once you add more clusters, regions, or teams with their own Prometheus instances, each place has good local visibility, but it becomes hard to see everything in one place or define alerts that cover all of them.
Prometheus federation stitches those views together. This article covers Prometheus federation architecture, common patterns, how it compares to remote write, and the main challenges and best practices for running it in production.
What is Prometheus Federation?
Prometheus federation is a way to connect multiple Prometheus servers without turning them into a single clustered database. Instead of pushing all metrics into one place, you keep separate Prometheus instances close to the workloads they scrape, and add one or more "federating" Prometheus servers that scrape data from those instances through the /federate endpoint.
Federation is still pull-based scraping. It does not add clustering, shared storage, or automatic sharding. It is a controlled way to compose a hierarchy of Prometheus servers so that you can answer cross-cluster questions and build global alerts without collapsing everything into one huge Prometheus deployment.
How Prometheus Federation Works
Each local Prometheus server scrapes exporters in its own cluster and writes samples to its TSDB. A separate federating Prometheus server then treats those local servers as scrape targets and pulls selected metrics from their /federate endpoint.
Understanding the /Federate Endpoint
The /federate endpoint exposes a filtered set of metrics from a Prometheus server. Instead of returning everything, it lets the caller specify which series to export using match [] selectors.
In this setup, the global Prometheus server scrapes only selected metrics from the Prometheus server in cluster A. You can repeat the same pattern for more clusters, regions, or environments.
Building a Hierarchy of Prometheus Servers
Federation is usually organized as a hierarchy. Local Prometheus instances sit close to workloads in each cluster or data center and scrape detailed metrics, including high-cardinality series. One or more higher-level Prometheus servers periodically scrape aggregated or filtered metrics from those local instances.
What Happens to Labels And Time Series
From the point of view of the global Prometheus server, metrics imported through federation are just regular time series. They can be queried with PromQL, combined with other metrics, and used in alerting rules. To avoid confusion and double-counting, federation setups usually add labels such as cluster, region, or environment on the local Prometheus side so the global server can tell where each series came from.
Because federation is still pull-based, there is no shared state or clustering between Prometheus servers. Each instance keeps its own retention and storage. The only connection is the scrape relationship between the global Prometheus server and the local ones through /federate.
Types of Prometheus Federation
Prometheus federation is flexible. The same /federate endpoint can support very different topologies, depending on how many Prometheus servers you run and which metrics you choose to export. Most setups fall into these common patterns.
Single-level Federation
The simplest pattern is a single global Prometheus server scraping multiple Prometheus instances directly. Each cluster or data center runs its own Prometheus server, and the global Prometheus server scrapes a subset of metrics from all of them.
You still keep local Prometheus servers responsible for detailed scraping and troubleshooting. The central Prometheus instance only pulls the series needed for global dashboards and alerts, such as up, key service latencies, error rates, and SLO (Service Level Objective) recording rules. This is enough for teams that need a cross-cluster view and a few global alerts.
Hierarchical Federation With Regional Layers
Larger setups add another layer between local and global. Instead of having one global Prometheus server scrape every Prometheus instance directly, you introduce regional or domain-level Prometheus servers.
The flow then looks like this:
- Local Prometheus instances scrape workloads in each cluster.
- Regional Prometheus servers federate metrics from those local instances in the same region or domain.
- A top-level global Prometheus server federates again from the regional layer.
This spreads the load. Each federation step only handles a slice of the total metrics, and the global Prometheus server only sees already-curated, low-cardinality data. It is a common pattern when you have many clusters or multiple data centers and want to avoid one huge federal Prometheus server doing all the work.
Thematic or Function-Based Federation
In some environments, federation is organized by concern rather than by geography. For example, you might keep one Prometheus server as the SLO and business metrics instance that federates only SLO-related recording rules and a few business KPIs from several other Prometheus servers.
Local Prometheus instances still own raw time series and detailed service metrics. The thematic Prometheus server focuses on a narrow set of series that matter to product or reliability reviews. This keeps the federated dataset small and stable and helps optimize resource usage on the Prometheus server that handles strategic queries, long dashboards, or executive views.
Setting Up Prometheus Federation
Getting Prometheus federation running involves planning the topology and being strict about which metrics move up the chain. The process involves: configuring external labels on each Prometheus instance, exposing the /federate endpoint, and adding scrape jobs on the central Prometheus instance that pull only the time series you need.
Prerequisites and Planning
Before wiring multiple Prometheus servers together, you should:
- Give every source Prometheus instance unique external_labels so you can tell clusters, regions, or services apart in the global view.
- Make sure network connectivity exists between your Prometheus instances on port 9090 or whichever port they expose.
- Reserve some headroom on the global Prometheus server. A central Prometheus instance that federates from many clusters usually needs more memory than a single non-federated server.
- Decide which labels identify boundaries you care about, such as cluster, region, datacenter, or service.
- Choose scrape intervals per level. A common pattern is short intervals at the leaf level, for example, 15–30 seconds, and longer intervals, for example, 30–60 seconds, on the central Prometheus instance to reduce load.
With those choices in place, you can move on to configuration.
Configuring Prometheus for Federation
Step1. Configure Source Prometheus Servers
Start by making each local Prometheus instance self-describing. External labels capture its identity, while scrape configs keep collecting detailed metrics from exporters as usual:
This Prometheus instance keeps full pod and node visibility for its own cluster. Those details stay local and do not have to travel to the global Prometheus server.
Step 2. Create Recording Rules for Aggregation
Federation works best when the leaf Prometheus servers pre-aggregate noisy, high-cardinality metrics. Recording rules convert a large number of low-level time series into a smaller set of job or cluster-level metrics that are much cheaper to move and store:
After this step, your leaf Prometheus instances expose both raw metrics and a set of stable, low-cardinality aggregates. The aggregated series are the ones you want the central Prometheus instance to scrape.
Step 3. Configure the Central or Aggregator Prometheus
Now configure the global Prometheus server as a regular Prometheus instance with extra scrape jobs that treat the other Prometheus servers as targets. It scrapes the /federate endpoint and uses match[] selectors to limit what it pulls:
With this setup, a single global Prometheus server federates from multiple Prometheus instances in different data centers. It pulls only job-level aggregates and a few core health metrics. That keeps cardinality low on the central Prometheus instance while still giving a global view across all clusters.
Kubernetes-Specific Federation Setup
If you run Prometheus via the Prometheus Operator, you can express the same idea through a ServiceMonitor that targets the /federate endpoint on other Prometheus servers running inside the cluster:
This turns federation into a core part of your Kubernetes monitoring stack. You discover Prometheus servers through labels, and the operator manages the underlying scrape configuration.
Handling Label Conflicts and Keeping Sources Distinct
When a central Prometheus instance scrapes multiple Prometheus servers, it needs a way to distinguish where a metric came from, and it must avoid label collisions. External labels and relabeling rules give you that control:
- Use external_labels on each leaf Prometheus server to add identifiers such as cluster, region, and datacenter.
- Where needed, use metric_relabel_configs on the global Prometheus server to add or normalize labels before it stores the federated time series.
At this point, you have a working Prometheus federation setup.
Benefits of Prometheus Federation
Prometheus federation helps you grow past a single server, keep clusters independent, and still build a shared view of the system. Here are some of its benefits:
- Scales with more clusters and teams: Each cluster or region runs its own Prometheus server, and a central Prometheus server scrapes only selected metrics. Growth means adding more Prometheus instances instead of stretching one server.
- Keeps local queries detailed and fast: Local Prometheus servers keep raw, high cardinality metrics for debugging and deep dives. The global Prometheus server stores only aggregated metrics, which keeps its resource usage under control.
- Limits the impact of failures: If one Prometheus server fails, it only affects that cluster’s dashboards and alerts. Local alerting continues elsewhere, and the global Prometheus server still serves data from healthy instances.
- Supports global SLOs and alerts: Each Prometheus instance can expose pre-aggregated SLO and error metrics. The central Prometheus server uses those to calculate global SLOs and fire alerts based on combined behaviour across clusters.
- Fits the existing Prometheus model: A federating Prometheus server is just another Prometheus instance with extra scrape targets. You keep using PromQL, the same rule syntax, and the same dashboards, which makes rollout easier.
This makes federation a practical way to connect many Prometheus instances without turning them into a single large database.
Common Use Cases for Prometheus Federation
Federation matters when you need a shared view across clusters, regions, or teams. Below are the most common ways it shows up in production.
Global SLOs and Error Budgets
Each Prometheus instance exposes pre-aggregated SLO and error rate metrics. A central Prometheus server pulls those time series and evaluates product-level SLOs, error budgets, and global alerts. Local SLOs stay in the leaf instances, while the global view tracks overall reliability.
Multi-data Center and Multi-region Overviews
Prometheus servers in different data centers or regions scrape local workloads. The central Prometheus server federates only traffic, latency, and availability metrics. Dashboards then show how load and errors are distributed by region or datacenter without copying every raw time series.
Shared Platform With Many Tenant Clusters
Platform teams that host many tenant clusters often run one Prometheus server per cluster. Federation lets them pull a narrow set of platform metrics, such as control plane health and core service SLOs, into a single Prometheus instance. This gives a platform-wide view without exposing tenant-specific details or high-cardinality labels.
Aggregated Business and Product Metrics
Application teams may record business counters and rates, such as sign-ups, orders, or API usage, in local Prometheus instances. A dedicated “business metrics” Prometheus server then federates just those aggregates. Product managers and executives use that instance for reports and long-running dashboards, while engineers keep technical metrics in the original servers.
Migration and Mixed-Generation Environments
When you move from a single Prometheus server to multiple servers, or when you trial remote write or a long-term storage system, federation can act as a bridge. One Prometheus instance can keep scraping existing exporters while another federates a subset of metrics for new dashboards and rules. This lets you change the topology gradually instead of in one risky step.
Prometheus Federation Architecture Explained
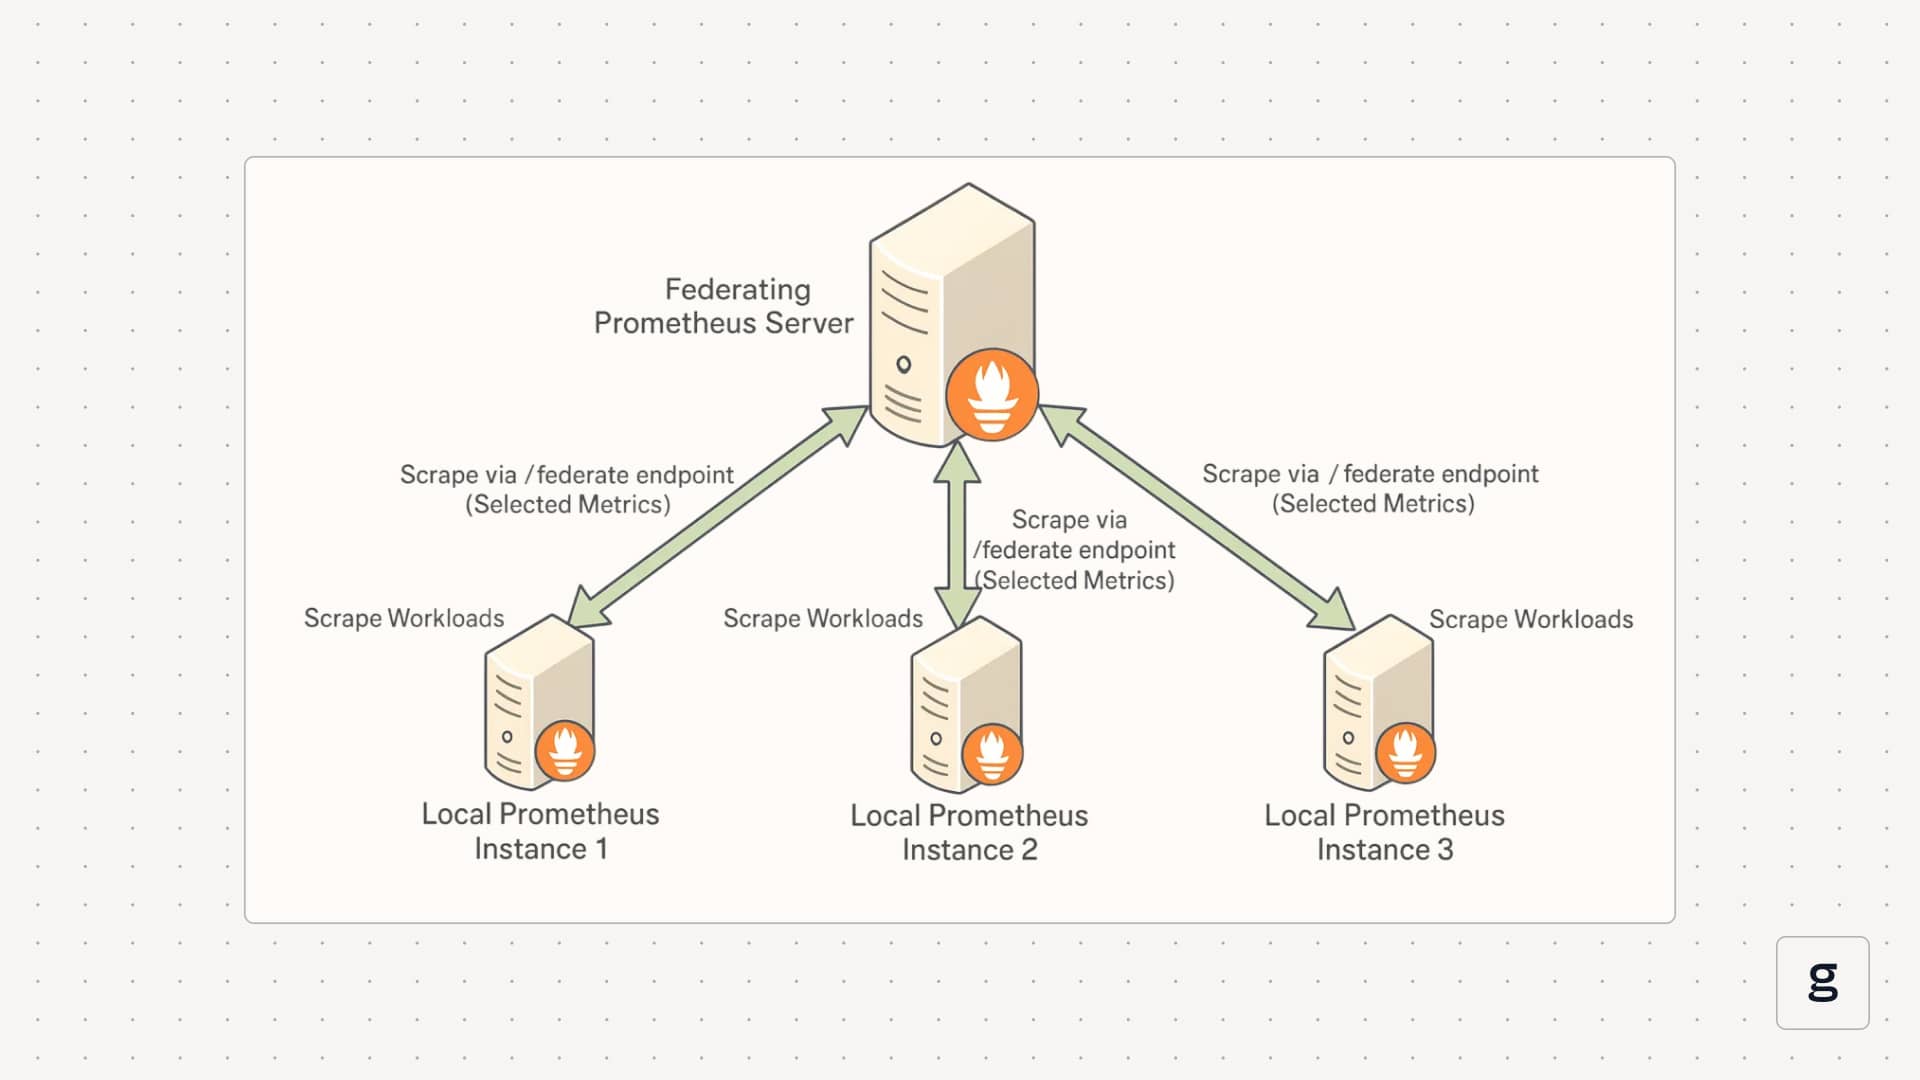
Prometheus federation uses a simple layered architecture:
.jpg)
Local Prometheus servers sit next to the workloads they scrape and store the detailed metrics. Above them, one or more federating servers pull a filtered view that powers cross-cluster dashboards and alerts.
Core Components of a Federated Setup
Exporters and Applications
Nodes, pods, services, and custom applications expose metrics through exporters such as node_exporter, kube-state-metrics, or custom /metrics endpoints. They are unaware of the federation. From their point of view, they just expose metrics over HTTP, and Prometheus comes to scrape them.
Local Prometheus Instances
Each cluster, region, or tenant runs its own Prometheus server. This local Prometheus instance scrapes exporters, stores samples in its TSDB, runs recording rules, and evaluates alerts that apply only to that scope. It holds detailed, high-cardinality metrics and is the first stop for on-call debugging and drill-downs.
Federating Prometheus Instances
One or more Prometheus servers act as aggregators. They do not talk to exporters directly. Instead, they scrape other Prometheus servers through the /federate endpoint, pull selected time series, and treat them like any other scraped metrics. These instances focus on aggregates, SLOs, and health signals that matter across clusters or regions.
You can think of local instances as producers of metrics and federating instances as consumers that build a summarized view.
Dataflow Through a Federated Stack
The data path stays pull-based from end to end. Exporters expose metrics on HTTP endpoints. Local Prometheus servers scrape those endpoints at their configured intervals and write samples into their own TSDB, appending to the WAL and rolling data into blocks as usual. Recording rules on local servers compute aggregates, SLOs, and other derived metrics from that raw data.
Federating Prometheus servers then scrape the /federate endpoint on each local server. They use match[] selectors to focus on those aggregates and a small set of health metrics instead of pulling every series. The results are stored in the TSDB of the federating Prometheus server and used for global dashboards and alerts.
There is no shared storage or clustering between instances anywhere in this flow. Each Prometheus server still runs as a single node with its own WAL, blocks, retention policy, and resource limits. Federation only adds extra scrape relationships between instances.
Single-Level vs Hierarchical Topologies
Most environments start with a single-level architecture. Several local Prometheus instances run in different clusters or data centers, and one central Prometheus instance scrapes all of them through /federate. That central instance holds the global view and evaluates cross-cluster alerts.
As the number of local instances grows, this pattern can turn into a bottleneck. At that point, teams move to a hierarchical layout. Local Prometheus instances continue to scrape workloads. Regional or domain Prometheus instances federate from locals in their area. A global Prometheus instance federates again from the regional layer. Each layer can have its own scrape intervals, retention settings, and resource sizing. This keeps the top-level Prometheus instance small and focused on the narrow set of metrics that matter system-wide.
Label Strategy and Metric Identity
Labels decide how usable the data is in the global view. Local Prometheus instances usually add identifiers such as cluster, region, datacenter, or tenant as external labels, so every series carries its origin with it. Federating Prometheus instances sets honor_labels: true so those labels are preserved when metrics are scraped through /federate.
On the federating side, optional relabeling rules can normalize names or add a source label that describes which Prometheus server exported a metric. This label scheme is what makes cross-cluster queries practical. For example, global SLO dashboards often group or filter by region and cluster, even though the underlying metrics were produced by many different Prometheus servers.
In a typical architecture, exporters and applications feed local Prometheus servers. Those local servers expose /federate with aggregated metrics and health signals. One or more federating Prometheus servers scrape those endpoints, store the results, and serve global dashboards and alerts.
Challenges and Limitations of Prometheus Federation
Prometheus federation helps tie multiple Prometheus servers together, but it does not remove the hard parts of scaling and operating them. It is still a set of single-node databases connected by scrape jobs, with all the trade-offs that implies.
Keeping these limitations in mind helps set realistic expectations for a federated design. The next step is to think about how to monitor the health of this chain of Prometheus servers and how to troubleshoot when links between them start to fail.
Monitoring and Troubleshooting Prometheus Federation
Once federation is running, the problem is no longer how to connect Prometheus servers, but how to see when that chain starts to fail. The federation layer can break in quiet ways, so it needs its own basic checks and signals, not just dashboards on top of it.
Check the Basic Health of /Federate
Confirm regularly that the global Prometheus server can reach each source and that the /federate endpoint returns data. A simple check against a few expected metrics per source Prometheus instance is often enough to spot broken links or access issues early.
Watch Scrape Success and Timing
Use Prometheus’ self-metrics on the global server to see if federation scrapes are succeeding and how long they take. If scrape errors appear more often or scrape durations move closer to the timeout over time, treat that as a sign to reduce load or adjust configuration before scrapes start to fail.
Control Scope to Avoid Timeouts and Overload
When federation scrapes run close to their timeout or begin to fail under load, narrow the match[] selectors, add more aggregation on the source, or split one large federation job into several smaller ones by region or domain. The aim is to keep the volume of data per scrape small enough that both source and global Prometheus servers stay within comfortable limits.
Validate Labels and Metric Identity
Check that external_labels on each source Prometheus instance are set correctly and that those labels appear intact on the global Prometheus server. If identifiers such as cluster, region, or datacenter are missing, inconsistent, or overwritten, cross-cluster queries and dashboards will give confusing results even if the underlying metrics are correct.
Monitor Federation Resource Usage and Series Counts
Track CPU, memory, and the number of federated series per job on the global Prometheus server. Steady growth in series counts or resource usage is a clear signal that you need to tighten selectors, add more recording rules, or rethink the federation topology before it turns into an outage.
Taken together, these checks make the federation layer visible as its own system rather than a hidden detail.
Best Practices for Prometheus Federation
Good habits around scope, labels, topology, and change management make the difference between a useful global view and a fragile chain of scrapes.
Start From the Questions You Need to Answer
Treat federation as a way to answer specific cross-cluster questions, not as a way to “copy everything to a global Prometheus.” Write down what you need from the global view: global SLOs, product-level error rates, regional traffic splits, or platform health. Export only the metrics that support those questions. If a metric is not part of a concrete global use case, keep it local.
Export Aggregates, Not Raw Metrics
Use recording rules on source Prometheus instances to compress noisy series into stable aggregates. Job-level, service-level, or cluster-level metrics are usually enough for global dashboards and alerts. Avoid federating pod-level or per-request metrics. This keeps cardinality low on the global Prometheus server, reduces scrape time, and makes queries easier to write.
Keep Label Design Strict and Consistent
Define a small, consistent set of identity labels, such as cluster, region, datacenter, and tenant, and treat them as required for any metric that leaves a local Prometheus instance. Use external_labels to attach them, and ensure federation jobs preserve them. Avoid ad hoc labels that leak implementation details into the global view. Clear, stable labels make global PromQL simpler and reduce the risk of mixing data from different sources.
Limit Cardinality and Watch Growth at the Top
Decide up front what “acceptable” looks like for the global Prometheus server in terms of time series count, memory usage, and scrape duration. Design federation rules so the central instance stays within that budget, and watch those numbers over time. When cardinality or scrape duration grows, tighten selectors, add more pre-aggregation, or split federation jobs before the global Prometheus server becomes a bottleneck.
Design Topology and Retention Deliberately
Choose a federation topology that matches your scale: single-level for a few clusters, or regional layers when the number of Prometheus instances grows. Give each layer its own scrape interval and retention settings. For example, keep longer retention and coarser data at the global level and shorter retention with fine-grained data at the local level. Federation is not long-term storage; if you need the full history of raw samples, use remote write or a separate time series store and keep federation focused on operational aggregates.
Treat Changes to Federation As Code
Manage external labels, recording rules, and federation jobs in version-controlled configuration, and roll out changes gradually. Test new match[] patterns and recording rules in a non-critical Prometheus instance or a staging environment before applying them to the main global Prometheus server. When you add a new cluster or region, follow the same documented steps so the federation layer grows in a predictable way instead of becoming a collection of one-off tweaks.
These practices turn federation from an improvised link between Prometheus servers into a clear part of your observability design.
How groundcover Enhances Prometheus Federation for Unified Observability
Prometheus federation gives you a scalable way to build a global metrics view, but it stays a metrics-only solution. You still have to pick which series to federate, keep labels under control, and rely on separate tools for logs and traces. groundcover sits next to that stack and fills in what federation cannot cover on its own.
Turns Federated Metrics Into Multi-Signal Views
Groundcover turns federated Prometheus metrics into entry points for full investigations. It collects HTTP requests, DNS lookups, database queries, system calls, and container activity at the kernel level and links them to logs, metrics, traces, and Kubernetes events. A global error rate or latency spike in Prometheus can then be tied directly to the specific pods, requests, and queries behind it.
Turns Selective Federation Into Broader Coverage
Prometheus federation requires match[] selectors, so missing or dropped metrics become blind spots at the global level. Groundcover reduces this risk by collecting kernel and application events by default instead of relying only on preselected series. You keep federated metrics lean while still having a rich, high-resolution view to investigate issues across clusters.
Turns Multi-Cluster Setup Into Simpler Operations
Federation needs scrape configs, relabeling, and recording rules for each new cluster and aggregation layer. Groundcover simplifies that by discovering workloads automatically once its eBPF sensors and collector run in each cluster. Data from many clusters flows into one portal, while Prometheus federation focuses on a smaller, curated metric set for SLOs and long-term trends.
groundcover Advantages Over Pure Federation
Faqs
What’s the difference between Prometheus federation and remote write?
Federation is pull-based and used for selective metric aggregation between Prometheus servers. Remote write is push-based and sends all chosen samples to an external backend for centralized, long-term storage and querying.
How can teams reduce data duplication and storage overhead in Prometheus federation setups?
Pre-aggregate metrics on leaf Prometheus, federate only essential aggregates with narrow match[] patterns, drop high-cardinality labels, and keep long retention only for aggregated series.
How does Groundcover improve scalability and simplify management in Prometheus federation environments?
groundcover auto-discovers clusters, uses eBPF for zero-instrumentation data collection, and provides a single multi-signal portal. This reduces federation config overhead and speeds up incident analysis without adding label-driven cardinality.
Conclusion
Prometheus federation is a way to keep multiple Prometheus servers independent while still building a shared view across clusters, regions, or teams. It works best when it exports only clear aggregates, uses strict labels for identity, and is treated as a focused layer for global SLOs and alerts rather than a catch-all storage solution.
Once you know its limits, it becomes easier to decide where federation fits, where remote write or long-term backends make more sense, and how tools like groundcover can sit alongside Prometheus to add logs, traces, and kernel-level visibility. With that split in mind, you can design a metrics and observability stack that grows with your infrastructure instead of turning into a single overloaded Prometheus server.


.svg)