Prometheus Cardinality: Causes, Impact, and Best Practices



Sometimes, high cardinality – which means having many unique values within a data set – is a good thing. It makes data more granular and helps teams home in on the root cause of problems. However, high cardinality also has downsides. Chief among them is the fact that more cardinality means more data to keep track of, which can in turn slow down observability tools. This issue can become especially problematic in systems like Prometheus, which (due to limitations like lack of support for a traditional clustered architecture) is harder to scale.
Hence the importance of controlling cardinality in Prometheus – which we discuss in this article by explaining which factors impact Prometheus cardinality, why high cardinality metrics can be an issue, and best practices for keeping cardinality reasonable in Prometheus environments.
What is Prometheus cardinality?
In Prometheus, cardinality refers to the total number of unique time series data points that exist within observability data.
The more unbounded labels (such as IP addresses or user IDs) that exist within a data set, the higher Prometheus cardinality typically is.
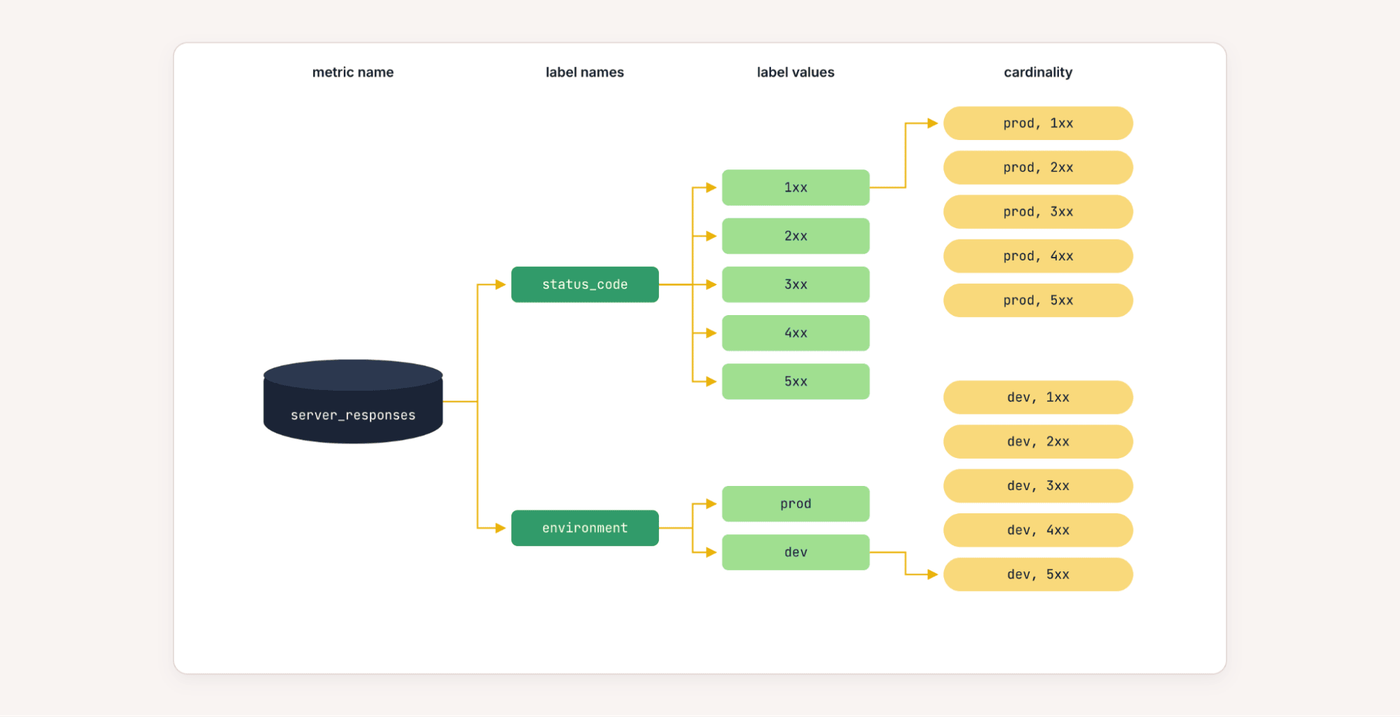
Key concepts behind Prometheus cardinality
To dive deeper into Prometheus cardinality, let’s discuss the technical components and concepts that impact how cardinality works in a Prometheus environment.
Metrics
Metrics are the bread and butter of Prometheus in the sense that tracking metrics is what allows Prometheus to identify anomalies and generate alerts within performance data. For this reason, virtually every Prometheus instance is configured to track a variety of metrics.
Metrics can come in many forms. They often include data like:
- CPU usage
- Memory usage
- Total number of HTTP requests
- Total number of errors
Time series
A time series refers to time-stamped numeric values for a specific metric. For example, if you’re tracking a node’s CPU usage, a time series could show what the CPU utilization is across a ten-minute period, with utilization reported every five seconds.
Labels
Labels are descriptors associated with metric names. Labels make it possible to add granularity to metrics and time series data by breaking collections of data into more discrete segments. However, every combination of labels (which we discuss below) and values creates a key-value pair that generates a new time series – so more labels typically mean higher cardinality.
For example, if you’re tracking HTTP requests as a metric, you could create a label named status to track requests that match a specific code (such as 200). By doing this, you’d be able to determine how many HTTP requests return code 200, and how often that type of event occurs within a specific set of time. The result is more granular visibility than you’d have if you simply tracked all HTTP requests.
Cardinality
Cardinality is a measure of how many unique data points exist within a data set. The more labels you create for Prometheus metrics, and the greater the number of values associated with each label, the higher the cardinality of your data is.
Why cardinality matters in Prometheus
Cardinality is important in Prometheus for two basic reasons:
- Without enough cardinality, monitoring data can be more difficult to analyze. For example, if you tracked total HTTP requests without labeling requests based on status, the data would be less meaningful because you wouldn’t be able to distinguish between different categories of responses (like successes vs. redirects).
- With too much cardinality, Prometheus may struggle to process data quickly and efficiently. This is because more labels lead to more data that Prometheus needs to store in memory. If the size of this data exceeds available memory, Prometheus will typically slow down. In extreme cases, it will crash due to OOM errors.
The issue of excessively high cardinality metrics is especially acute in Prometheus because, unlike many other types of monitoring and observability platforms, Prometheus doesn’t have a native clustering capability. It’s designed to run on a single server, so you can’t simply create a Prometheus cluster and add servers to increase memory availability. You can use Prometheus federation to gain some scaling capabilities for Prometheus, but because federation still depends on a single central server, it doesn’t solve memory availability issues when dealing with high-cardinality data.
| Cardinality scenario | Impact on monitoring | Example and mitigation |
|---|---|---|
| Too little cardinality | Insufficient label detail can make metrics less useful because teams cannot separate important categories or identify specific issues. | Tracking only total HTTP requests provides limited insight. Adding a low-cardinality label such as response status code makes it possible to distinguish successful requests, redirects, and errors. |
| Too much cardinality | Excessive unique label combinations increase the amount of data Prometheus must store and process, which can reduce performance and increase resource usage. | Large numbers of labels can cause slower queries, higher memory consumption, and, in severe cases, out-of-memory failures. Limit unnecessary labels and monitor time series growth to prevent resource exhaustion. |
How metric types affect Prometheus cardinality
As we said above, metrics are one key component that impacts Prometheus cardinality because the more metrics you track, and the more labels you create for each one, the higher the cardinality of your data.
But there’s additional nuance surrounding the relationship between metrics and cardinality in Prometheus because there are four distinct types of metrics you can collect, and each affects cardinality in a different way.
Here’s a look at each metric type and its relationship to cardinality.
1. Counters
Counters typically have a relatively low impact on Prometheus cardinality because they only increase over time and usually represent cumulative values such as requests, errors, or completed operations. Cardinality depends less on the metric type itself than on the labels attached to it.
However, problems may arise when counters include high-cardinality labels such as user IDs, session IDs, request IDs, or dynamically generated paths. Each unique label combination creates a separate time series, which can quickly overwhelm Prometheus regardless of the simplicity of the counter metric.
2. Gauges
Gauges measure values that can increase or decrease, such as memory usage, queue depth, or the number of active connections. Like counters, gauges have no inherent effect on cardinality, but they can become expensive when combined with large numbers of unique label values.
Gauges are particularly prone to cardinality issues when used to track highly dynamic resources, such as ephemeral containers, short-lived jobs, or individual client sessions. Limiting labels to stable infrastructure attributes helps keep the number of time series under control.
3. Histograms
Histograms can significantly increase Prometheus cardinality because every histogram generates multiple time series. In addition to the _sum and _count metrics, each configured bucket creates its own metric, all of which are duplicated for every unique label combination.
The number of buckets directly affects cardinality, making it important to choose bucket boundaries carefully. Combining histograms with high-cardinality labels can multiply the total number of time series and substantially increase storage requirements and query costs.
4. Summaries
Summaries also generate multiple time series, including _sum and _count, along with separate time series for each configured quantile. Although summaries generally produce fewer time series than large histograms, they still increase cardinality compared to counters and gauges.
Unlike histograms, summary quantiles are calculated on the client rather than during query execution, making them difficult to aggregate across multiple instances. To minimize cardinality, avoid unnecessary quantiles and pair summaries only with stable, low-cardinality labels.
Common causes of high cardinality in Prometheus
If you’re facing excessive cardinality in Prometheus, it’s likely that one or more of the following causes is at play:
- Dynamic labels: Using labels such as user IDs, session IDs, request IDs, or transaction IDs creates a new time series for every unique value, causing cardinality to grow rapidly.
- Ephemeral infrastructure: Monitoring short-lived Kubernetes Pods, containers, serverless functions or jobs can generate a constant stream of new label combinations as workloads are created and destroyed.
- Unbounded label values: Labels that contain values with no practical limit (such as URLs, IP addresses, timestamps, or file paths) can produce an extremely large number of unique time series.
- Excessive label combinations: Even low-cardinality labels can create a large number of time series when many labels are combined on a single metric because every unique combination becomes its own series.
- Overuse of histograms and summaries: Configuring too many histogram buckets or summary quantiles, especially when paired with numerous labels, multiplies the number of time series that Prometheus must store and query.
| Cardinality risk | Why it increases cardinality | How to reduce the impact |
|---|---|---|
| Dynamic label values | Labels that change frequently, such as individual users, sessions or requests, create separate time series for each unique value, and can quickly overwhelm Prometheus. | Replace highly variable labels with broader categories or remove them entirely. Use aggregation when detailed tracking is not required. |
| Short-lived workloads | Temporary resources like Kubernetes Pods, containers, and serverless functions continuously create new metrics as instances appear and disappear. | Focus monitoring on stable workload identifiers and avoid attaching metrics to short-lived resources unless necessary. |
| Unlimited label values | Labels with potentially infinite variations, including URLs, IP addresses, timestamps, and file paths, can generate an unmanageable number of unique series. | Normalize or group values into predefined categories. Avoid exposing raw, high-variance data as metric labels. |
| Too many label dimensions | A metric with multiple labels can experience exponential growth because every unique combination of label values creates a separate time series. | Limit the number of labels per metric and only include dimensions that support meaningful monitoring or troubleshooting. |
| Overly complex histograms and summaries | Excessive histogram buckets or summary quantiles multiply the number of stored series, especially when combined with many labels. | Use only the buckets and quantiles needed for specific use cases and avoid applying detailed distributions across high-cardinality dimensions. |
How high cardinality impacts Prometheus performance and costs
As we’ve said, cardinality that is too high can cause Prometheus to use excessive amounts of memory. But that’s not all. When Prometheus runs low on memory, other issues occur.
One is slow overall performance. The rate at which Prometheus responds to queries will typically go down, and it may take longer to ingest metrics as well, due to having your Prometheus starved of memory.
Costs can also increase due to high cardinality, particularly if you host Kubernetes using cloud infrastructure where you pay as you go. In that case, you may end up needing to purchase more expensive cloud server instances to provide the memory necessary to support high cardinality data. Even in on-prem or self-hosted environments, you might need to purchase more expensive servers, or buy more memory for them.
Identifying and measuring cardinality issues in Prometheus
To determine whether you’re facing cardinality issues in Prometheus, start by determining which metrics generate the largest number of time series. Prometheus provides built-in APIs and metadata that allow operators to measure the total number of active series, identify metrics with the most unique label combinations, and analyze label values that contribute most to cardinality growth. In addition, visualization platforms such as groundcover can help track time series counts over time, making it easier to spot sudden increases caused by new applications, Kubernetes workloads, or instrumentation changes.
Importantly, measuring cardinality and identifying high cardinality metrics should be an ongoing operational practice rather than a one-time task. Teams should establish baseline time series counts, monitor cardinality trends, and set alerts for unexpected increases that could affect memory usage, query performance, or storage costs. Regular metric reviews, combined with instrumentation audits and label analysis, help identify unnecessary labels, redundant metrics and other sources of excessive cardinality before they impact Prometheus performance.
Practical examples of Prometheus cardinality problems
To ground the discussion further, let’s look at a couple of real-world scenarios of high cardinality in Prometheus, and ways to resolve the issue.
Example 1: Unbounded label values
A common example of unbounded label values occurs when an application exports an HTTP request metric with the full request URL as a label, such as /users/12345 or /users/67890. Although the metric itself may be useful, every unique URL creates a new label value and therefore a new Prometheus time series. As the application serves more users and resources, the number of time series grows without limit, increasing memory consumption, slowing queries, and raising storage requirements.
The best solution in this scenario is to replace unbounded labels with stable, low-cardinality values. Instead of using the full request path, expose a normalized route such as /users/{id} or /orders/{orderId}. You could also group requests by endpoint name rather than individual resource identifiers. In addition, teams should review application instrumentation regularly to identify labels whose values can grow indefinitely and remove or normalize them before they cause excessive cardinality.
Example 2: Reducing cardinality with aggregation
Another common example involves monitoring database queries. An application might expose a metric with the raw SQL statement as a label, causing every variation of a query to create a separate time series. Even parameterized queries can generate thousands of unique label combinations if table names, query text, or dynamically generated statements are included. Over time, this dramatically increases Prometheus cardinality while providing little additional operational value.
A better approach is to aggregate metrics into meaningful categories instead of tracking every unique query. For example, group metrics by operation type, such as SELECT, INSERT, UPDATE, or DELETE, or by application component or database service. This aggregation preserves visibility into database performance trends while dramatically reducing the number of unique label combinations that Prometheus must store and query.
Best practices for managing Prometheus cardinality
To get ahead of cardinality issues in Prometheus and mitigate them efficiently when they do occur, consider the following best practices:
- Design low-cardinality labels: Use stable labels such as service, environment, region, and status code instead of values that change frequently. Avoid labels containing user IDs, request IDs, timestamps, or other values that can grow without limit.
- Review instrumentation regularly: Audit application metrics during development and after deployments to identify unnecessary metrics and labels. Removing redundant or overly detailed metrics early prevents long-term cardinality growth.
- Aggregate metrics whenever possible: Group data into meaningful categories instead of exposing metrics for every individual resource or event. Aggregation preserves operational insights while significantly reducing the number of unique time series.
- Monitor cardinality continuously: Track total time series counts, identify metrics with the highest cardinality, and investigate unexpected increases before they affect Prometheus performance. Regular monitoring helps control memory usage, query latency, and storage costs.
| Best practice | Why it matters | How to implement it |
|---|---|---|
| Keep label values consistent | Stable, predictable labels prevent the number of time series from growing unnecessarily, improving Prometheus performance and reducing resource consumption. | Use fixed labels such as service name, deployment environment, region, and HTTP status. Avoid dynamic values like user IDs, request IDs, session IDs, and timestamps. |
| Audit metrics and labels | Regular reviews help identify metrics and labels that no longer provide operational value before they create unnecessary overhead. | Evaluate instrumentation during development and after releases. Remove duplicate, obsolete, or overly granular metrics and simplify labels where possible. |
| Aggregate data instead of tracking every event | Aggregated metrics provide meaningful visibility while generating far fewer unique time series than per-resource or per-event metrics. | Report counts, averages or totals across logical groups such as services, clusters or namespaces instead of creating separate metrics for every object or request. |
| Watch cardinality over time | Detecting cardinality increases early helps prevent excessive memory usage, slower queries, and rising storage requirements. | Monitor total time series counts, identify the metrics with the most unique label combinations, and investigate unexpected spikes before they impact Prometheus performance. |
Design patterns for cardinality-safe metrics in Kubernetes
In addition to the generic best practices we just described, the following design patterns or strategies can help reduce cardinality challenges when using Prometheus to monitor a Kubernetes cluster:
- Use stable Kubernetes object values: Design metrics around long-lived Kubernetes resources such as Deployments, StatefulSets, Namespaces, or Services instead of individual Pods or containers. Because Pods are frequently created, terminated, and replaced, using higher-level resource labels helps prevent unnecessary time series growth while still providing meaningful operational visibility.
- Aggregate metrics by workload: Expose metrics at the workload or application level rather than for every individual request, connection, or resource. For example, report request counts by service or deployment instead of by Pod instance, allowing teams to monitor application health without generating excessive label combinations.
- Normalize dynamic label values: Replace dynamic values with standardized categories before exporting metrics. For example, use normalized HTTP routes (such as /api/users/{id}) instead of full request paths, and group response codes into stable values where appropriate. This approach preserves useful insights while preventing unbounded label growth that can overwhelm Prometheus.
Reducing cardinality impact with deep runtime visibility in groundcover
The tricky thing about cardinality is that, no matter how well you plan, it’s tough to predict exactly how cardinality will impact performance at runtime. You can, and should, follow best practices for keeping cardinality reasonable, but you may still run into suboptimal conditions depending on what data Prometheus ends up actually scraping.
This is why observability solutions like groundcover are so important. By cluing admins in early to memory availability issues, slower query performance, or changes to Prometheus performance following adjustments to metrics or label configurations, groundcover helps ensure continuous, real-time visibility into cardinality’s impact on Prometheus. In turn, it helps teams optimize configurations to achieve the greatest level of monitoring insights without compromising on performance or overpaying for infrastructure.
Navigating the Scylla and Charybdis of Prometheus cardinality
Having a strategy to manage high-cardinality metrics in Prometheus is a bit like navigating between the Scylla and Charybdis – the two sea monsters that Odysseus has to sail between. Cardinality that’s too low makes data hard to interpret, while excessively high cardinality leads to performance issues and wasted money.
That’s why it’s important to deploy design patterns that provide a healthy level of cardinality – along with tools, like groundcover, to help confirm that cardinality is always where it should be during runtime.
FAQs
Labels containing highly dynamic or unbounded values – such as user IDs, request IDs, IP addresses, URLs and timestamps – are the most common cause of excessive Prometheus cardinality.
Key best practices for balancing observability and performance include using stable, low-cardinality labels, aggregating metrics where appropriate, and regularly reviewing instrumentation to eliminate unnecessary time series.
groundcover provides real-time visibility into Prometheus performance to help engineers identify instances where high-cardinality metrics are causing degradations. In addition, groundcover helps analyze label usage and optimize telemetry to reduce resource consumption while maintaining comprehensive observability.