Kubernetes Architecture Diagram: Components & Best Practices


How a Kubernetes cluster behaves in production comes down to its architecture. The control plane, the way worker nodes are attached, and the layers for networking and security all influence reliability and latency. They also determine how safe it is to run many services next to each other.
A Kubernetes architecture diagram makes it easier to reason about where control decisions are taken, how pods end up on specific worker nodes, and how traffic flows between them. When something breaks or performance drifts, it helps you trace requests, compare your expectations with reality, and pinpoint which part of the architecture needs to change.
What is Kubernetes Architecture?
Kubernetes architecture is the structure behind a Kubernetes cluster. It covers how the control plane makes decisions and how worker nodes run the workloads.
The control plane exposes the API, stores cluster state, schedules pods, and runs controllers that keep the cluster close to the configuration you define. Worker nodes host the container runtime and pods, and report back what is actually running on each node.
Instead of starting processes directly on servers, you describe the desired state as Kubernetes resources such as `Deployment`, `StatefulSet`, or `DaemonSet`. The control plane takes that desired state, decides where to place pods, when to restart them, and how to react when nodes fail or capacity changes. That ongoing loop between the control plane and the worker nodes is the core of the architecture.
What is a Kubernetes Architecture Diagram?
A Kubernetes architecture diagram is a visual representation of how the components of a Kubernetes cluster interact with each other. Rather than treating the control plane and worker nodes as black boxes, the diagram shows how they fit into the wider system. You can trace how requests move across the cluster, where boundaries exist between layers, and how different Kubernetes resources depend on one another. This helps when reviewing a new cluster, planning changes, or comparing your setup with the architecture you expect to see.
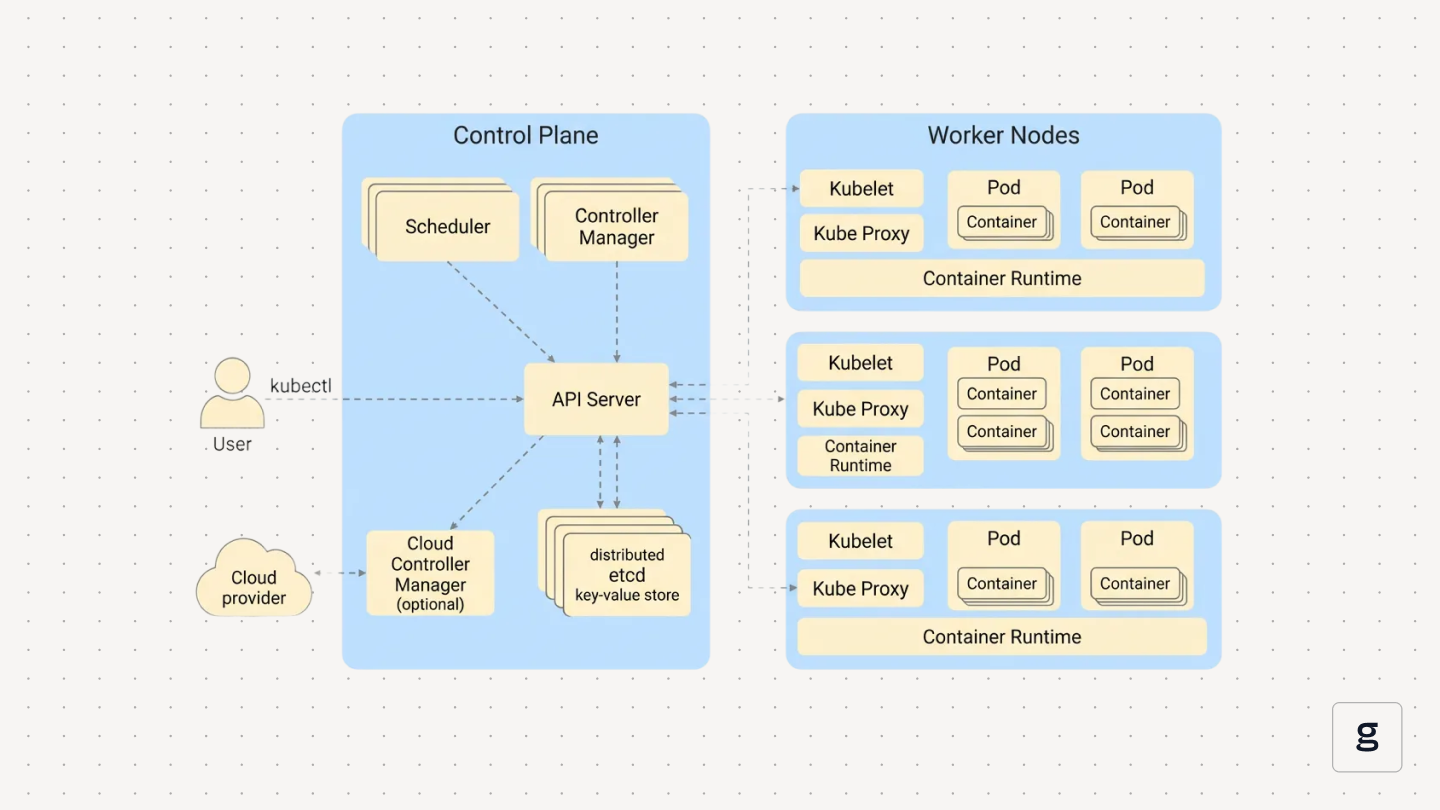
Kubernetes Architecture Components
A Kubernetes cluster is split between the Kubernetes control plane and the worker nodes.
The control plane components accept requests, store cluster state, schedule work, and run control loops. Worker nodes run the container runtime and pods, and expose networking so traffic can reach those pods. A good Kubernetes architecture diagram draws this line clearly, then shows how each key component talks to the others. Here are the components of the Kubernetes architecture
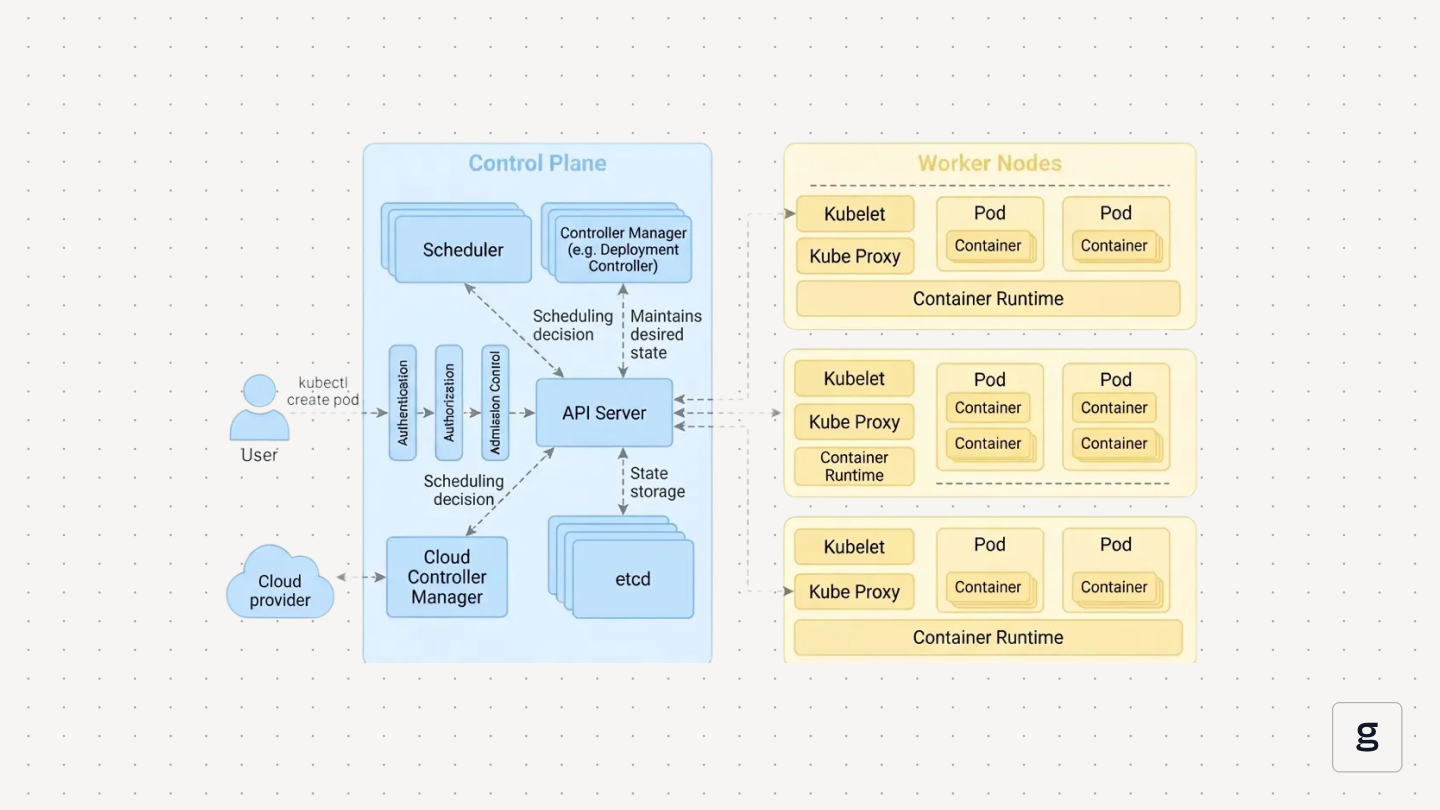
API Server
The API server (`kube-apiserver`) is the entry point to the cluster. It exposes the Kubernetes API, validates requests, applies authentication and authorization, and stores or retrieves state from etcd. Every component talks to the cluster through it, which makes the API server the central point of coordination.
Scheduler
The scheduler (`kube-scheduler`) assigns pods to worker nodes. It filters nodes based on requirements, scores the remaining options, and picks a placement. This decision is written back to the API server, so the kubelet on the chosen node can act.
Controller Manager
The controller manager runs the control loops that keep the cluster aligned with the desired state. Controllers watch for changes, compare actual vs expected state, and create or remove resources when needed. This includes Deployments, ReplicaSets, StatefulSets, and node lifecycle logic.
Etcd
Etcd stores the cluster’s configuration and state. It uses strong consistency, so every component reads the same data. The API server is the only component that talks to etcd directly, which keeps the control plane predictable and easier to secure.
Cloud Controller Manager
The cloud controller manager connects Kubernetes to cloud provider services. It creates load balancers, attaches volumes, and updates routes based on Kubernetes resources. This keeps cloud-specific logic separate from the main control plane.
Kubelet
Kubelet runs on each worker node. It pulls pod assignments from the API server, starts containers through the container runtime, mounts volumes, handles readiness and liveness checks, and reports node status back to the control plane.
Kube Proxy
Kube-proxy handles Service networking. It updates iptables or IPVS rules so traffic sent to a Service is forwarded to the correct pod IPs. This enables ClusterIP, NodePort, and LoadBalancer routing inside the Kubernetes cluster.
Together, these Kubernetes components and worker node agents form the base layer of any architecture diagram.
Kubernetes Architecture Variations
No two Kubernetes clusters look exactly the same. Different teams make different choices about how to deploy the control plane, where workloads should run, which tools manage the cluster lifecycle, and how far they extend Kubernetes with custom logic.
- Control plane deployment: Some clusters run a single control plane node with stacked etcd for development. Production setups usually spread control plane components across several nodes, often with etcd on its own machines or a managed control plane from a cloud provider. High availability here decides how well the cluster architecture tolerates node or zone failures.
- Workload placement: Workloads rarely share all nodes evenly. Node pools, affinity rules, taints, and tolerations steer specific pods toward general-purpose nodes, storage-heavy nodes, or GPU nodes. In multi-tenant environments, namespaces, quotas, and placement rules keep teams isolated even when they share the same Kubernetes cluster.
- Cluster management tools: Some platforms build clusters with kubeadm or similar tooling and manage every control plane node themselves. Others rely on managed services such as EKS, GKE, or AKS, and then add multi-cluster layers on top to coordinate several Kubernetes clusters. The tooling you pick becomes part of the architecture because it defines how upgrades, scaling, and recovery work.
- Custom functionality: Many clusters go beyond built-in resources. Custom Resource Definitions, operators, and admission webhooks add platform-specific logic and policy. Once these extensions are drawn on the architecture diagram, it becomes easier to see which parts of the system are core Kubernetes and which are unique to your environment.
These variations explain why two clusters that both run Kubernetes can behave very differently once real workloads hit them.
Benefits of Visualizing Kubernetes Architecture
A Kubernetes architecture diagram is most useful when it matches the real cluster. In that case, it becomes part of everyday work. Teams use it to review changes, plan capacity, and understand how requests move.
Over time, the architecture diagram becomes the reference point for anyone who needs to change the cluster, debug it, or explain how it is put together.
Networking in Kubernetes Architecture
Networking is the layer that turns a set of control plane components and worker nodes into a functioning Kubernetes cluster. The Kubernetes architecture diagram shows this clearly, from pod IPs on each node to Services, load balancers, and security controls that shape traffic.
Networking in the Architecture
- Pod-to-pod communication: Each pod gets its own IP. A CNI plugin configures the node network so these pod IPs are reachable across all worker nodes. Pods in the same Kubernetes cluster can talk directly by IP, which keeps application code simple.
- Service routing and load balancing: Services provide stable virtual addresses on top of changing pod IPs. ClusterIP, NodePort, and LoadBalancer types expose the same backend pods through different entry points. Kube-proxy updates routing rules so traffic sent to a Service is spread across healthy pods.
- NetworkPolicies and CNI plugins: NetworkPolicies define which pods and namespaces are allowed to talk to each other. Enforcement depends on the CNI plugin. Some plugins only provide basic connectivity. Others add policy, encryption, or multi-cluster support, which all change how the architecture behaves under load or during an incident.
- Securing east-west traffic: Most traffic is internal service-to-service traffic. NetworkPolicies, mTLS from a service mesh, and clear namespace boundaries help keep that east-west traffic limited to what is needed. Sensitive databases or control plane integrations often sit behind stricter rules than general application pods.
When these networking layers are drawn on the architecture diagram, it becomes easier to see how traffic really flows and where additional safeguards are needed.
Security in Kubernetes Architecture
Security sits across the entire Kubernetes architecture. RBAC protects the API, Pod Security Standards control what runs on worker nodes, NetworkPolicies shape traffic, and Secrets and TLS secure the data that moves between components. These layers work together rather than in isolation.
Role-Based Access Control (RBAC)
RBAC controls who can interact with the API server and what actions they can take. It relies on clear roles and role bindings so access stays predictable. Strong RBAC reduces the chance of accidental changes and limits the impact of compromised credentials.
Pod Security Standards
Pod Security Standards define which capabilities, host access, and privilege levels pods are allowed to use. They keep unsafe configurations out of the cluster by enforcing defaults at the namespace level. This helps stop pods from gaining broad access to worker nodes or the wider Kubernetes cluster.
Secure Secrets Management
Secrets store credentials, tokens, and certificates. Using them correctly means limiting access, enabling encryption at rest, and avoiding embedding sensitive data in images or manifests. Controllers and kubelet read Secrets through authenticated API calls rather than local files, which keeps distribution controlled.
TLS Between Components
TLS protects communication within the control plane and between it and worker nodes. The API server, kubelet, and other components verify each other using certificates. This prevents traffic inspection and stops untrusted components from joining the Kubernetes cluster.
These pieces form the main security boundary of the architecture. When they appear clearly on the architecture diagram, it becomes easier to spot gaps and avoid weak defaults before workloads rely on them.
Best Practices for Kubernetes Architecture
A Kubernetes architecture depends on habits that keep clusters predictable, secure, and easier to operate. The architecture diagram helps show where these habits apply, but the practices themselves come from how the control plane and worker nodes behave day-to-day.
- Use namespaces for organization: Namespaces group workloads and set boundaries for access, quotas, and policies. They help separate teams or environments without needing separate clusters. Clear namespace structure reduces accidental cross-team impact and keeps RBAC simpler.
- Set resource requests and limits: Requests guide the scheduler. Limits protect nodes from runaway pods. When both are set, the Kubernetes control plane can place workloads more accurately and avoid noisy neighbour issues on worker nodes.
- Enable auto-healing and scaling: Kubernetes is built around controllers that react to changes. Readiness probes, liveness probes, Horizontal Pod Autoscalers, and Cluster Autoscalers make use of that design. With these enabled, the cluster replaces unhealthy pods and adds or removes capacity as demand changes.
- Use health checks: Liveness and readiness probes tell the kubelet and Services when a pod is ready or needs a restart. These checks prevent traffic from reaching containers that are still starting up or stuck. They also help kube-proxy route traffic only to healthy endpoints.
- Monitor with lightweight observability tools: Observability does not need to overload the cluster. Lightweight metrics and event-based monitoring make it easier to follow control plane decisions, track pod behaviour, and see resource pressure on worker nodes. Tools like groundcover keep this overhead small while adding useful visibility.
- Apply node affinity and tolerations: These rules guide placement so the scheduler sends the right workloads to the right hardware. GPU jobs go to GPU nodes, storage-heavy workloads land on storage-optimized nodes, and system pods stay isolated. This keeps resource usage predictable and reduces surprise contention.
When you enforce these practices consistently, the architecture diagram starts to reflect a cluster that behaves well under load, scales smoothly, and is easier to operate over time.
Common Kubernetes Architecture Challenges
Even well-designed clusters run into issues once real workloads, traffic patterns, and team workflows settle in. Many of these problems become easier to spot when they are mapped on a Kubernetes architecture diagram.
A clear architecture diagram will help pinpoint where the challenge is occurring.
Architecture Patterns in Real-World Kubernetes Deployments
Architecture patterns show how Kubernetes clusters behave once they are deployed. The Kubernetes architecture diagram looks different in each case, but the same control plane components and worker nodes sit underneath.
Microservices on EKS
On Amazon EKS, the cloud provider runs the control plane. Teams focus on worker nodes, node groups, and the workloads themselves. Microservices run as separate Deployments, each with its own Service and often its own namespace and IAM role. External traffic comes through an AWS load balancer and an Ingress controller. The diagram ends up showing many small services, all talking over internal Services inside one Kubernetes cluster.
Multi-tenant SaaS with Namespaces
A multi-tenant SaaS platform often uses namespaces as the main isolation layer. Each tenant gets a namespace with its own quotas, NetworkPolicies, and RBAC bindings. Automation creates and labels these namespaces so billing, limits, and policies stay consistent. On the architecture diagram, you see many parallel namespace slices on top of a shared control plane and shared worker nodes.
Event-driven Apps with Kafka
Event-driven systems frequently pair Kubernetes with Kafka. Kafka brokers run as a StatefulSet with PersistentVolumes. Producers and consumers run as standard Deployments that scale horizontally with load. The architecture diagram highlights the path from application pods to Kafka Services and back out to consumers, which shows clearly how storage, CPU, and autoscaling must line up.
Stateful Applications with Persistent Volumes
Databases and stateful applications use StatefulSets with PersistentVolumeClaims. Each pod keeps a stable identity and its own volume. A headless Service exposes those pods when direct addressing is needed. In the diagram, this pattern appears as a group of pods anchored to storage on a specific node pool, which makes the dependency between scheduler decisions, node choice, and storage performance easy to see.
Canary Deployments with Service Meshes
Service meshes add a traffic layer on top of core Kubernetes networking. Sidecar proxies sit next to pods, and a mesh control plane manages how much traffic flows to each version. Canary releases send a small share of requests to the new version, then gradually increase that share if metrics look healthy. On the architecture diagram, this appears as a mesh layer between Services and pods, with routes that split traffic between old and new versions without changing the core control plane.
These patterns give architecture diagrams something concrete to show. They turn boxes and arrows into real deployment shapes that you can compare against when designing or revisiting their own clusters.
Tools to Create Kubernetes Architecture Diagrams
Several tools can help you keep a Kubernetes architecture diagram accurate and useful. But they differ in how much they automate and how much control you have over the final layout.
You will often need to combine these approaches. Automation keeps the architecture diagram close to reality, while manual tools help shape clearer versions for reviews and documentation.
How groundcover Supports Kubernetes Architecture
A Kubernetes architecture diagram shows how control plane components and worker nodes fit together. groundcover adds the missing layer on top of that picture. It shows how the cluster actually behaves under real workloads without reshaping your architecture or adding heavy agents.
eBPF-based Visibility With no Code Changes
groundcover uses eBPF sensors on worker nodes to observe system calls, network traffic, and process behaviour. It does this without sidecars or code changes in your applications. That keeps the architecture clean while still giving a detailed view of what pods and nodes are doing when the cluster is busy.
Cluster Health in Architectural Context
groundcover monitors node health, pod restarts, and resource usage across namespaces and workloads. It ties these signals back to control plane components and worker nodes. When a node pool is saturated, or a namespace causes noisy neighbour issues, you see that in the same terms as on the architecture diagram, not as a flat list of metrics.
Configuration and Rollout Awareness
Changes in configuration often explain sudden shifts in behaviour. groundcover records deployment rollouts, ConfigMap updates, Secret rotations, etc, along a timeline. During an incident, you can align that history with the architecture and see which Service, Deployment, or namespace changed just before errors or latency increased.
Traffic Flows Across Services and Namespaces
groundcover builds service and dependency maps from live traffic. These maps mirror the paths on the architecture diagram, from Ingress or gateway to Services and then to pods on worker nodes. You can see which Services depend on which backends, how requests move between namespaces, and where retries or timeouts appear in real flows.
Used together with a current architecture diagram, groundcover turns the cluster from a static drawing into a system you can observe, explain, and adjust with confidence.
Conclusion
A Kubernetes architecture diagram makes the cluster easier to understand. It shows how the control plane, worker nodes, networking, and security fit together, so design choices and problems are easier to reason about. When that diagram matches the real environment and is backed by live signals from groundcover, it turns into more than documentation. It becomes a practical tool for planning changes, troubleshooting incidents, and keeping Kubernetes clusters stable as they grow.


.svg)